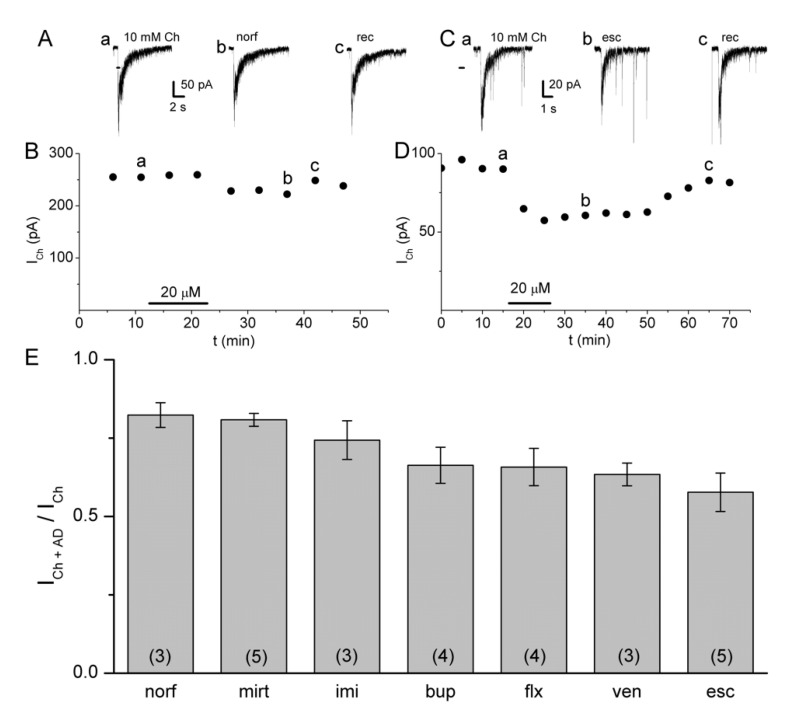
Figure 2.
Samples of the current elicited by choline (ICh) recorded in interneurons from the stratum radiatum rat hippocampal CA1 region and inhibited by 20 μM norfluoxetine (A,B) and 20 μM escitalopram (C,D) as a function of time. Data labeled as a, b, and c in (B,D) correspond to upper records in (A,C): control (a), maximal inhibited (b), and recovered (c) ICh. (E) The height of the columns corresponds to the ratio ICh+AD/ICh for each antidepressant at 20 μM. ICh+AD corresponds to the ICh in the presence of the corresponding antidepressant. From left to right: norf, norfluoxetine. mirt, mirtazapine. imi, imipramine. bup, bupropion. flx, fluoxetine. ven, venlafaxine. esc, escitalopram. Data correspond to the mean ± standard error. The number of independent experiments is in parenthesis. Comparison of the experimental data with their own control means was performed by paired Student’s t-test. p < 0.05 was considered statistically significant for all the antidepressants. The nonparametric Kruskal–Wallis test resulted in significant differences between different groups. The Mann Whitney Wilcoxon Post hoc analysis revealed no significant differences between pairs of groups.

