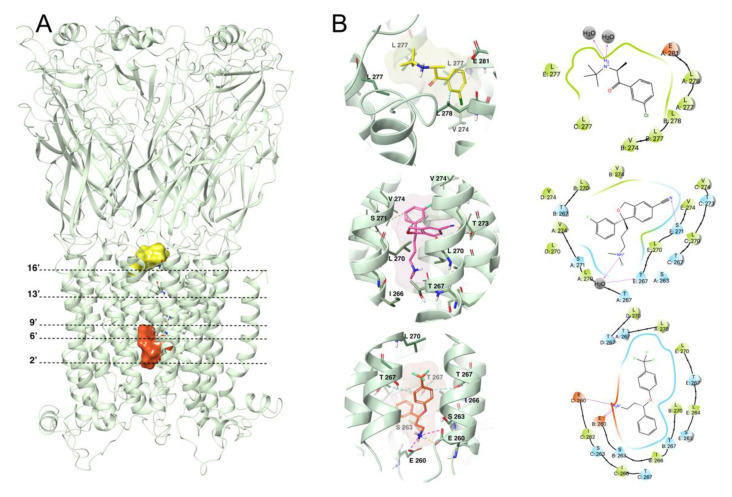
Figure 6.
(A) Representation of the general location of antidepressants in the ion channel. The position of the representative rings is indicated by dotted lines. (B) Images corresponding to the last conformation of bupropion (yellow), escitalopram (pink), and norfluoxetine (orange) in the ion channel of the rat α7 nAChR homology model binding pocket after a 100 ns Molecular Dynamics simulation. Hydrophobic interactions, H-bonds, and ionic interactions are shown in cyan, yellow, and fuchsia, respectively.

