Figure 5.
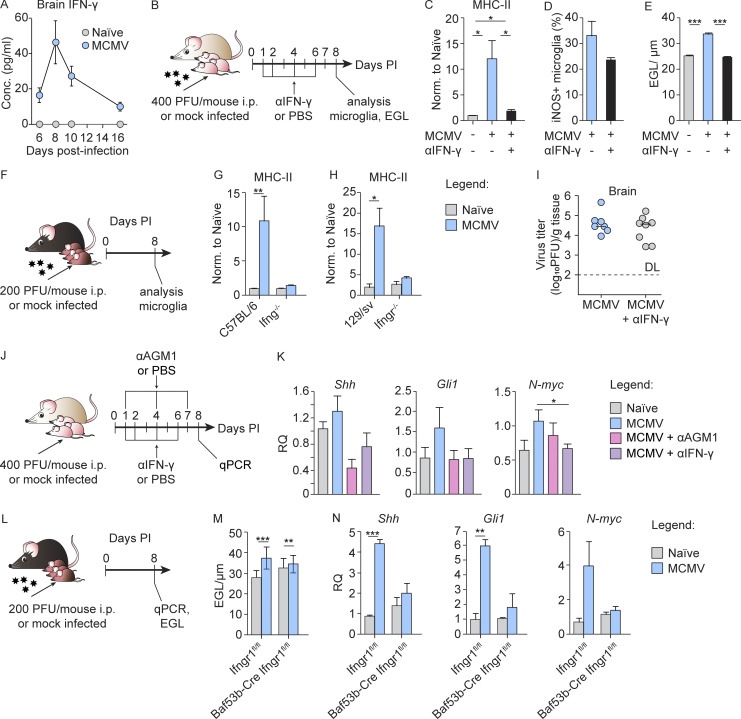
IFN-γ induces early activation of microglia and altered cerebellar development. (A) Newborn BALB/c mice were infected with MCMV. Brains were collected at the indicated time points p.i. The concentration of IFN-γ in brain homogenates is shown. Mean values ± SEM are show (n = 3–6). The data are representative of two independent experiments. (B) Experimental scheme for C–E and I. Newborn BALB/c mice were infected with MCMV and IFN-γ was neutralized in vivo by administration of anti–IFN-γ antibody. (C and D) Expression of MHC-II on microglia (C) and iNOS production (D) on day 8 p.i. were analyzed by flow cytometry. Mean values ± SEM are shown (n = 3–5). The data are representative of two (D) or three (C) independent experiments. Unpaired two-tailed Student’s test was used. *, P < 0.05. (E) Cerebellar EGL measurements. Mean values ± SEM are shown (n = 3–5). The data are representative of three independent experiments. Unpaired two-tailed Student’s test was used. ***, P < 0.001. (F) Experimental scheme for G and H. (G and H) Postnatal day 1 C57BL/6 and Ifng−/− (G) or 129/sv and Ifngr−/− mice (H) were infected with MCMV. Expression of MHC-II on microglia from C57BL/6 and Ifng−/− mice (G) and 129/sv and Ifngr−/− mice (H). Mean values ± SEM are shown (n = 3–5). The data are representative of two independent experiments. Unpaired two-tailed Student’s test was used. *, P < 0.05; **, P < 0.01. (I) Brains were collected on day 8 p.i., and viral titers were determined. Titers in brain of individual mice are shown (circles); horizontal bars indicate the median values; DL, detection limit (n = 5–8). The data are representative of three independent experiments. Mann–Whitney (U) test was used. (J) Experimental scheme for K. Newborn BALB/c mice were infected with MCMV. NK cells were depleted in vivo. IFN-γ was neutralized in vivo by administration of anti–IFN-γ antibody. (K) Expression of Shh, N-myc, and Gli1 in the cerebella measured by qPCR. Mean values ± SEM are show (n = 3–5). The data are representative of two independent experiments. Unpaired two-tailed Student’s test was used. *, P < 0.05. RQ (relative quantification). (L) Experimental scheme for M and N. Postnatal day 1 Baf53b-CreIfngr1flox/flox and Ifngr1flox/flox mice were infected with MCMV. (M) Cerebellar EGL measurements (N) expression of Shh, N-myc, and Gli1 in the cerebella measured by qPCR. Mean values ± SEM are shown (n = 3–5). The data are representative of two independent experiments. Unpaired two-tailed Student’s test was used. **, P < 0.01; ***, P < 0.001.

