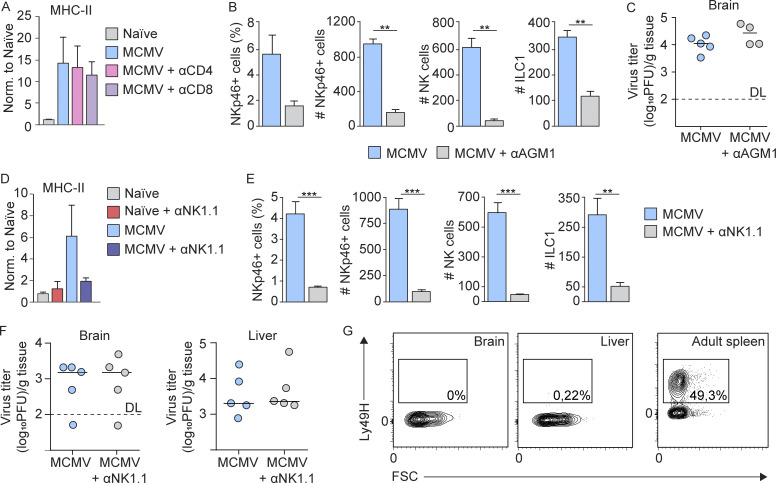
Figure S2.
The role of T and NK cells in microglia activation and virus control in brain. (A) CD4 and CD8 T cells are not responsible for early microglia activation. Newborn BALB/c mice were infected with MCMV, and CD4 or CD8 T cells were depleted. Expression of MHC-II on microglia is shown. Mean values ± SEM are shown (n = 4). The data are representative of two independent experiments. Unpaired two-tailed Student’s test was used. (B–G) Depletion of NK cells in mice infected with MCMV did not impact the viral titer in the brain. (B and C) Newborn BALB/c mice were infected with MCMV, and NK cells were depleted. (B) The frequency and number of NKp46+ cells and number of NK cells and ILC1 in the brain on day 8 p.i. are shown. Mean values ± SEM are shown (n = 3). The data are representative of two independent experiments. Unpaired two-tailed Student’s test was used. **, P < 0.01. (C) Brains were collected on day 8 p.i., and viral titers were determined. Titers in brain of individual mice are shown (circles); horizontal bars indicate the median values; DL, detection limit (n = 4–5). The data are representative of two independent experiments. Mann–Whitney (U) test was used. (D–G) Postnatal day 1 C57BL/6 mice were infected with MCMV, and NK cells were depleted (D–F). (D and E) Expression of MHC-II on microglia (D) and the frequency and number of NKp46+ cells and number of NK cells and ILC1s in the brain (E) on day 8 p.i. are shown. Mean values ± SEM are shown (n = 3). The data are representative of two independent experiments. Unpaired two-tailed Student’s test was used. **, P < 0.01; ***, P < 0.001. (F) Brains and liver were collected on day 8 p.i. and viral titers were determined. Titers in brain and liver of individual mice are shown (circles); horizontal bars indicate the median values; DL, detection limit (n = 5). The data are representative of two independent experiments. Mann–Whitney (U) test was used. (G) The flow cytometric analysis of Ly49H expression on NK cells in the brain and liver following perinatal MCMV infection and in the adult spleen are shown (n = 3). The data are representative of two independent experiments.

