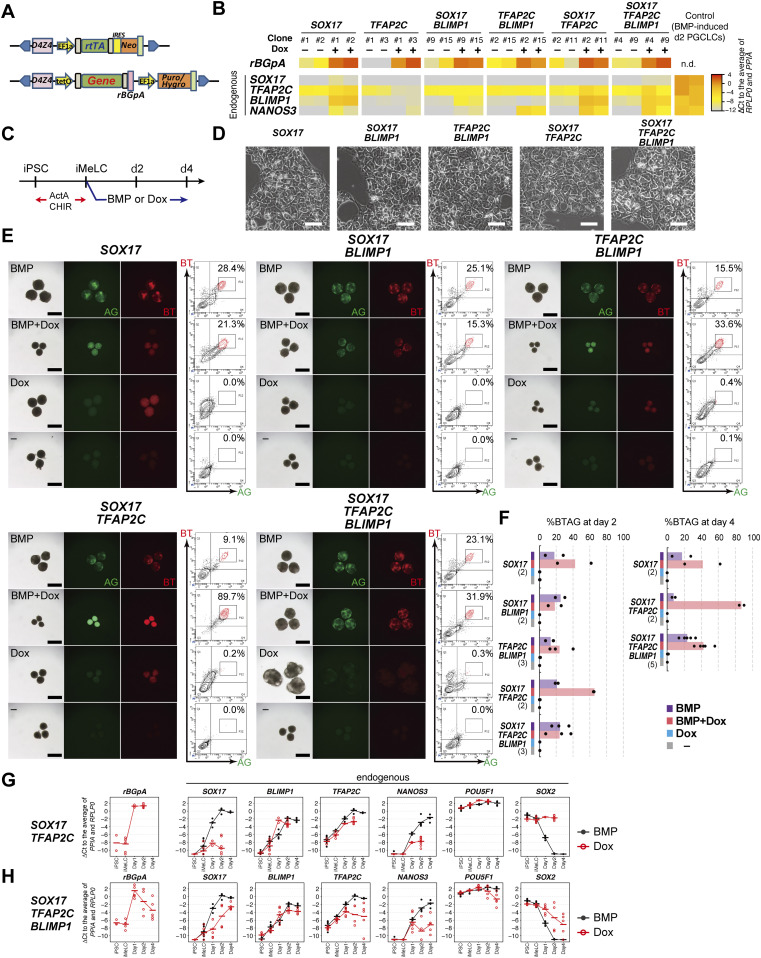
Figure 1. SOX17, TFAP2C, and BLIMP1 do not create human primordial germ-cell-like cells (hPGCLCs).
(A) A schematic of the vectors used for Dox-inducible expression. The coding sequence of each gene was cloned in the designated position. D4Z4: D4Z4 macrosatellite repeat insulator; EF1α: promoter sequence of human EEF1A1; rtTA: reverse tetracycline trans-activator; IRES: internal ribosome entry site; Neo: Neomycin resistance gene; tetO: Tet operator sequence; rBGpA: rabbit β-globin polyadenylation signal; Puro/Hygro: resistance gene for puromycin/hygromycin. (B) Heat map representation of the expression levels of the indicated genes in the designated hiPSC clones stimulated with (+) or without (−) Dox (1.0 μg/ml) for 24 h. Two clones were examined for each transgene combination. To quantify the expression levels of the transgenes or endogenous genes by qRT-PCR, primer pairs for the rBGpA or 3′ untranslated regions were used, respectively, and the ΔCt was calculated from the average Ct value of two housekeeping genes, RPLP0 and PPIA (set as 0). (C) The protocol for hPGCLC induction. iMeLC aggregates were induced for hPGCLC fate by bone morphogenetic protein 4 (BMP4) or Dox (1.0 μg/ml) in the presence of stem cell factor, EGF, and leukemia inhibitory factor. ActA: activin A; CHIR: CHIR99021. (D) Phase-contrast images of iMeLCs in the designated clones. No apparent morphological differences were seen among the clones. Representative images of at least two independent experiments are shown (shown in Fig 1F). Bar: 50 μm. (E) Bright-field and fluorescence (TFAP2C-EGFP [AG] and BLIMP1-tdTomato [BT]) images, and FACS analyses for BTAG expression in floating aggregates of the indicated transgene-expressing clones at day 4 of the indicated stimulation. (−): induction only with stem cell factor, EGF and leukemia inhibitory factor. Representative images of at least two independent experiments are shown (see Fig 1F). Bars, 200 μm. (F) Percentage of BT+AG+ cells of the indicated transgene-expressing clones with the indicated stimulations at day 2 (left) and day 4 (right). Dots represent values for each experiment and the bars represent their averages. The numbers of inductions performed are shown in parenthesis. (G, H) Expression dynamics of rBGpA (transgenes) and the indicated endogenous genes in the SOX17/TFAP2C (G) and SOX17/TFAP2C/BLIMP1 (H) clones induced by BMP4 (black) or Dox (red). d1: whole aggregates; d2/d4: BT+AG+ cells for induction by BMP4, BT+ cells for induction by Dox. For each gene, the ΔCt was calculated from the average Ct value of two housekeeping genes, RPLP0 and PPIA (set as 0). (G, H) Three independent experiments with two SOX17/TFAP2C clones (G) and three SOX17/TFAP2C/BLIMP1 clones (H) were performed.

