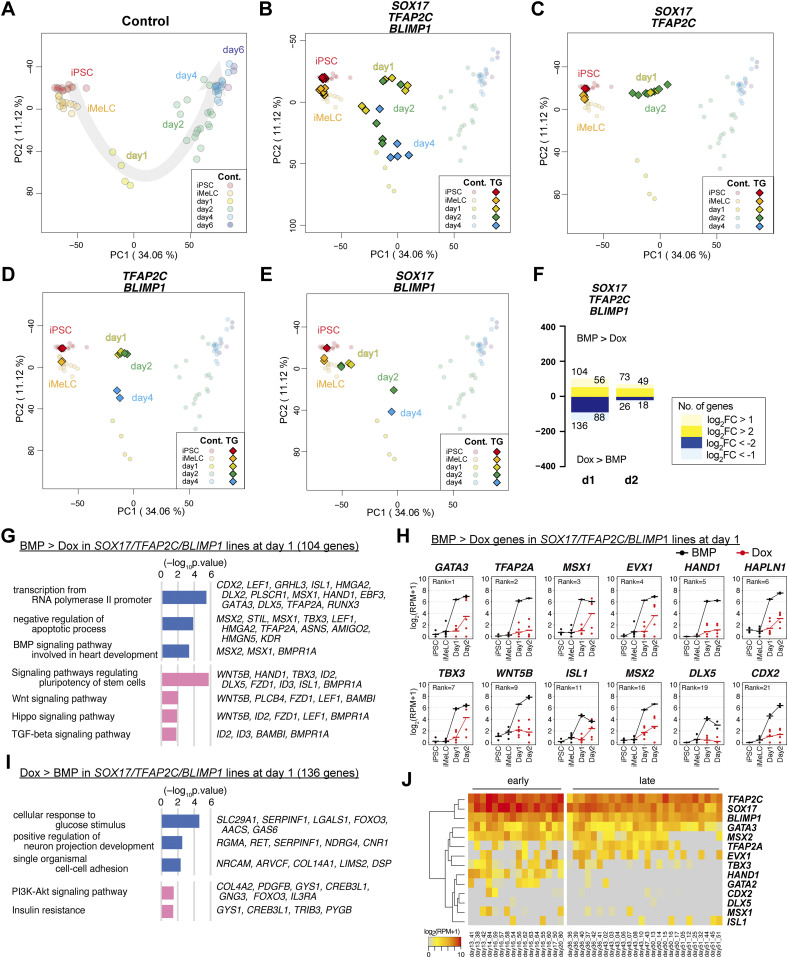
Figure 2. Transcriptome analysis of the effects of the transcription factor expression.
(A, B, C, D, E) Principal component analysis (PCA) of the effects of the transcription factor expression (see the Materials and Methods section for details). (A) The PCA plots of the cells (hiPSCs, iMeLCs, d1 whole aggregates, d2/d4/d6 BT+AG+ cells) derived from the parental clone (585B1 BTAG). The developmental progression is indicated by an arrow. (B, C, D, E) The PCA plots of the SOX17/TFAP2C/BLIMP1 (B), SOX17/TFAP2C (C), TFAP2C/BLIMP1 (D), and SOX17/BLIMP1 (E) clones (squares) are overlaid with those of the parental clone (circles with pale color). See Table S1 for the samples analyzed. The color coding is as indicated. (F) The numbers of the differentially expressed genes at d1/d2 between bone morphogenetic protein (BMP)– and Dox-stimulated cells of the SOX17/TFAP2C/BLIMP1 clones (P < 0.01 by Tukey–Kramer test, log2[RPM + 1] > 4 in cells with higher expression, log2[fold change: FC] >1 [up, pale yellow; down, pale blue] or 2 [up, yellow; down, blue]). d1: iMeLC whole aggregates; d2: BT+AG+ and BT+ cells for BMP- and Dox-stimulated cells, respectively. Note that the numbers of differentially expressed genes were smaller at d2, because the gene expression of the BT+ cells of the Dox-induced SOX17/TFAP2C/BLIMP1 clones was somewhat variable. (G, I) Gene ontology terms (blue) and KEGG pathways (pink) enriched in differentially expressed genes between BMP- and Dox-stimulated d1 SOX17/TFAP2C/BLIMP1 clone aggregates. (G, I) Representative genes up-regulated in BMP- (G) or Dox- (I) stimulations and P-values are shown. (F, H) Expression dynamics of the genes up-regulated at d1 (F) in BMP-stimulated (black) compared with Dox-stimulated (red) SOX17/TFAP2C/BLIMP1 clone-derived cells. The ranks of the genes ordered by the fold changes between BMP and Dox stimulation are shown. Note that TFAP2A, HAND1, HAPLN1, MSX2, and CDX2 were highly up-regulated in BMP-stimulated cells also at d2 (Fig S2B). See Table S1 for the samples analyzed. (E, H, J) Heat map representation of the expression of the genes in (H) in cynomolgus monkey fetal germ cells (early: embryonic day (E) 13-E17; late: E36-E51) (9, 18, 30, 31).

