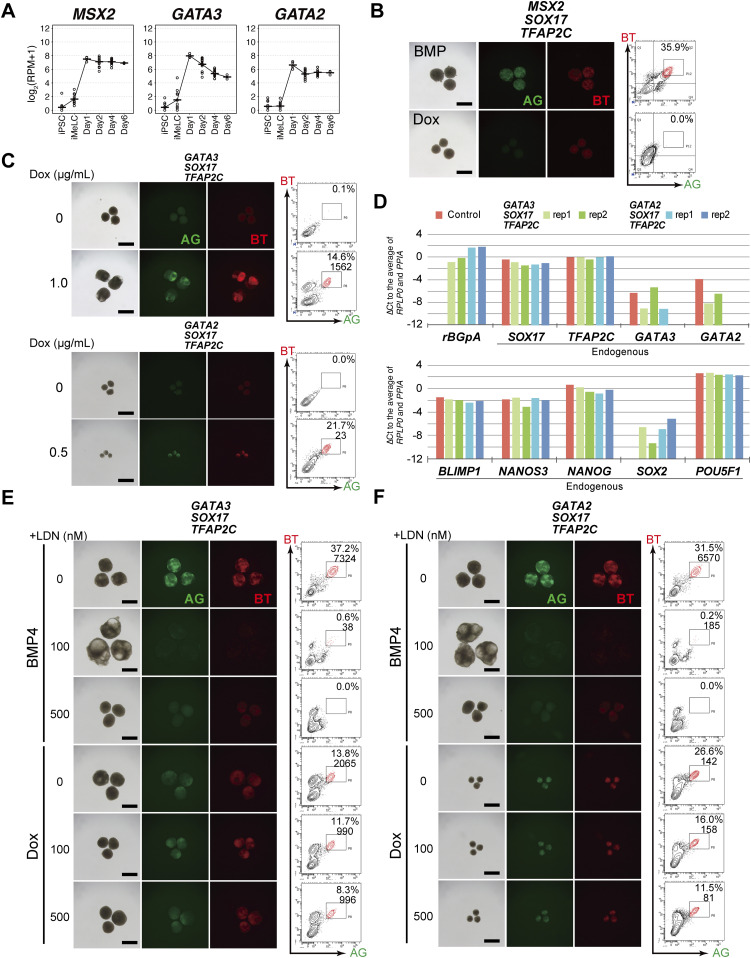
Figure 3. GATA3/2, SOX17, and TFAP2C generate human primordial germ-cell-like cells.
(A) Expression dynamics of MSX2, GATA3, and GATA2 during bone morphogenetic protein (BMP)-driven human primordial germ-cell–like cell induction from the parental hiPSCs. Log2(RPM + 1) values are plotted and the bars indicate the mean value of each time point. See Table S1 for the samples analyzed. (B) Bright-field and fluorescence (AG/BT) images, and FACS analyses for BTAG expression in floating aggregates of the MSX2/SOX17/TFAP2C clone induced by BMP4 or Dox at d4. Representative images of three independent experiments are shown. Bars, 200 μm. (C) Bright-field and fluorescence (AG/BT) images, and FACS analyses for BTAG expression in floating aggregates of the GATA3/SOX17/TFAP2C clone (top) and GATA2/SOX17/TFAP2C clone (bottom) induced with or without Dox 1.0 μg/ml at d4. Representative images for 10 (GATA3/SOX17/TFAP2C) and six (GATA2/SOX17/TFAP2C) experiments are shown. Bars, 200 μm. (D) Expression of rBGpA (transgenes) and the indicated endogenous genes in BMP-induced parental clone-derived and Dox-induced GATA3/SOX17/TFAP2C clone- and GATA2/SOX17/TFAP2C clone-derived d4 BT+AG+ cells. Two replicates from independent experiments were analyzed. For each gene, the ΔCt was calculated from the average Ct value of two housekeeping genes, RPLP0 and PPIA (set as 0). (E, F) Bright-field and fluorescence (AG/BT) images, and FACS analyses for BTAG expression at d4 in floating aggregates of the GATA3/SOX17/TFAP2C (E) and GATA2/SOX17/TFAP2C (F) clones induced by BMP4 or Dox with 0, 100, 500 nM of LDN193189. Representative images of at least two independent experiments are shown. Bars, 200 μm.

