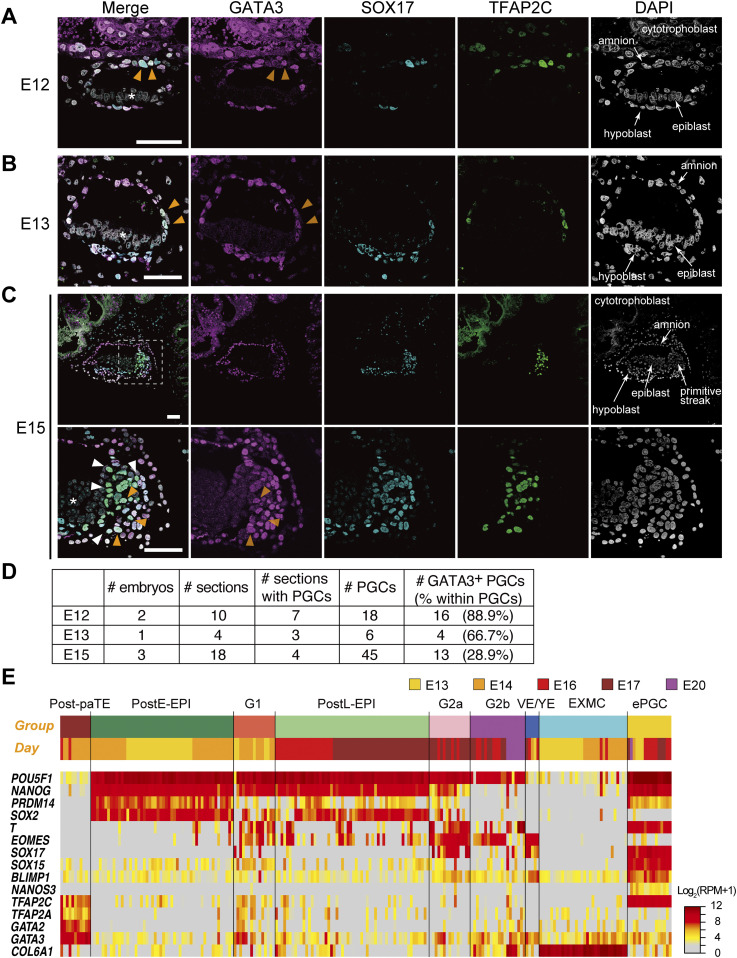
Figure 6. GATA3 expression in post-implantation cynomolgus monkey embryos.
(A, B, C) Immunofluorescence analysis of GATA3 (magenta), SOX17 (cyan), and TFAP2C (green) expression (merged with DAPI) in cynomolgus monkey embryos at E12 (A), E13 (B) and E15 (C). For E15 (C), the boxed area (top) is magnified (bottom). Orange arrowheads indicate triple-positive PGCs, whereas white arrowheads indicate SOX17/TFAP2C+ but GATA3− cells. Note that there was no signal in the epiblast (asterisk). (D) Representative images of the samples shown in (D) are presented. Bars, 50 μm. (D) The numbers of embryos (E12, E13, and E15), total sections, and sections with PGCs (SOX17+TFAP2C+ cells), PGCs, and GATA3+ PGCs analyzed/detected in this study. (E) Heat map representation of the expression of key genes in the indicated cell types of the post-implantation cy embryos (30). The colored bars on top indicate cell types (top) and embryonic days (bottom), respectively. The color coding is as indicated. Post-paTE, PostE-EPI, post-implantation early epiblast; G1, gastrulating cells, group 1; postL-EPI, post-implantation late epiblast; G2a/G2b, gastrulating cells, group 2a/2b; VE/YE, visceral endoderm/yolk sac endoderm; EXMC, extraembryonic mesenchyme; ePGC, early PGC.

