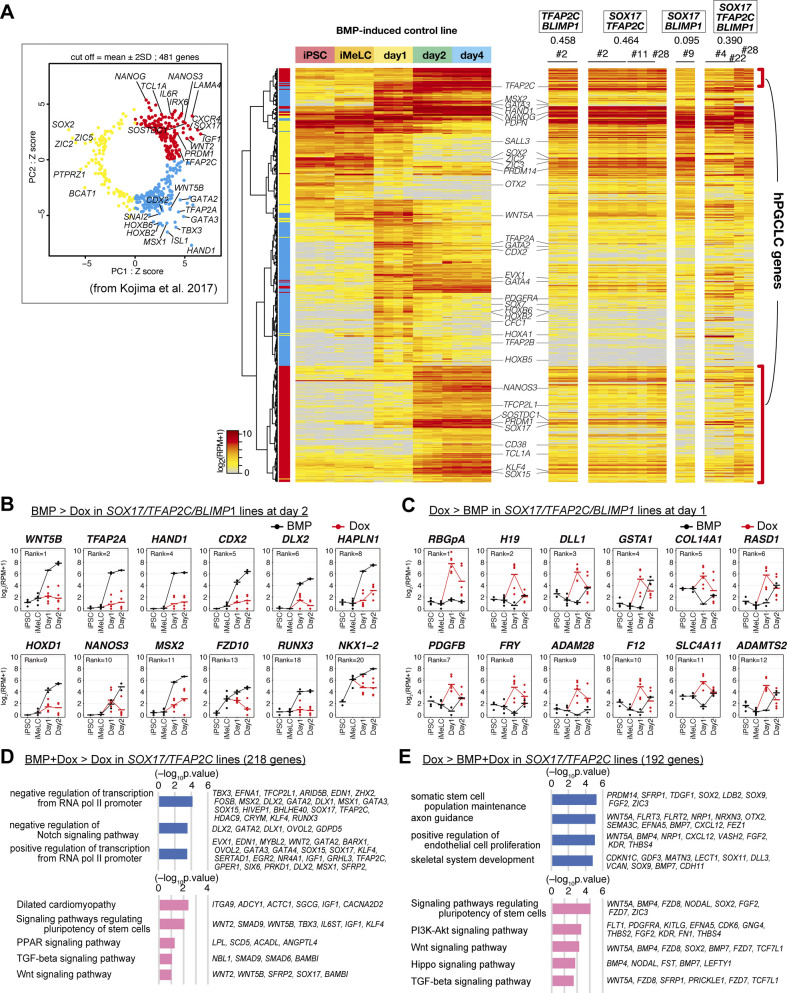
Figure S2. Transcriptome analysis of the effects of the transcription factor expression.
(A) (left) Principal component analysis of the expression of the 481 genes characterizing human primordial germ-cell–like cell specification shown in reference 13. Red (first quadrant): genes for PGCLC specification; cyan (fourth quadrant): genes for endoderm/mesoderm specification; yellow (second and third quadrants): genes for pluripotency (right). Heat map representation of the expression of the 481 genes in the parental hiPSCs, iMeLCs, bone morphogenetic protein (BMP)4-induced d1 whole aggregates, and d2/d4 BT+AG+ cells, and in TFAP2C/BLIMP1, SOX17/TFAP2C, SOX17/BLIMP1, SOX17/TFAP2C/BLIMP1 clone-derived, Dox-induced d2 BT+ cells. Representative genes are annotated, and the correlation coefficient values of each induction with the d4 BT+AG+ cells are shown. The color coding is as indicated. (B, C) Expression dynamics of the genes up-regulated in BMP-stimulated (black, BT+AG+) compared with Dox-stimulated (red, BT+) d2 cells (B) (Note that TFAP2A, HAND1, CDX2, HAPLN1, and MSX2 were highly up-regulated also at d1 [Fig 2H]) or those up-regulated in Dox-stimulated (red) compared with BMP-stimulated (black) SOX17/TFAP2C/BLIMP1 clone-derived d1 iMeLC aggregates (C). The bars indicate the mean value of each time point, and the ranks of the genes ordered by the fold changes between BMP- and Dox-stimulation are shown. See Table S1 for the samples analyzed. (D, E) Gene ontology terms (blue) and KEGG pathways (pink) enriched in differentially expressed genes between BMP and Dox- and Dox-stimulated SOX17/TFAP2C clone-derived cells at d2 (BMP and Dox: BT+AG+; Dox: BT+). (D, E) Representative genes up-regulated in BMP and Dox- (D) or Dox- (E) stimulations and P-values are shown.

