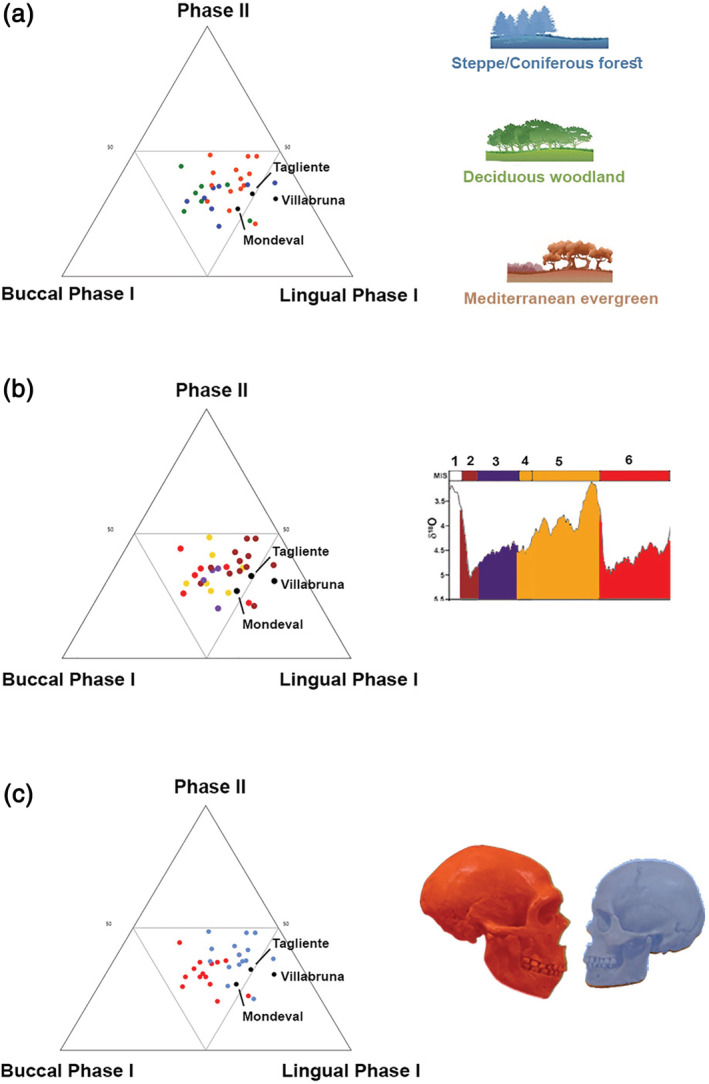
FIGURE 4.

Ternary diagrams showing the proportions (in %) of relative wear surface of Buccal Phase I areas, Lingual Phase I areas, and Phase II areas (Kay & Hiiemae, 1974), which are positioned in an equilateral triangle. Each base of the triangle represents a ratio of 0% while the vertices correspond to a percentage of 100%. Our three individuals (Tagliente, Villabruna, and Mondeval) were identified in the ternary plots as black points. (a) Ecozones‐based group; (b) MIS‐based group; (c) species‐based group (Red: Homo neanderthalensis, blue: Homo sapiens)
