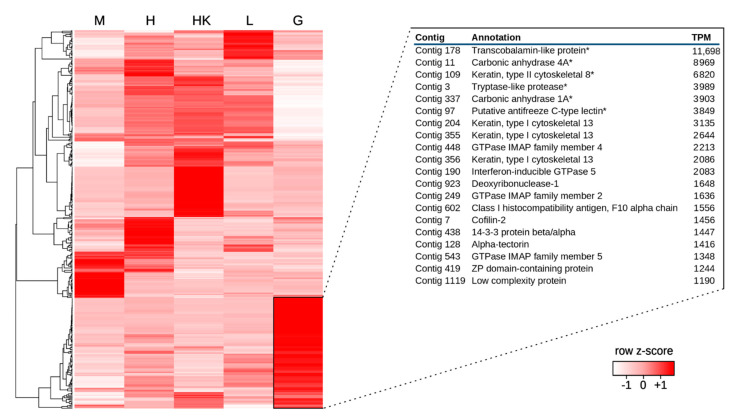
Figure 2.
Hierarchical clustering of a set of representative genes (achieving a TPM value > 1000 in at least one tissue), based on the gene expression levels, i.e., Log10(TPM+1), of skeletal muscle (M), hearth (H), head kidney (HK), liver (L), and gills (G). Genes were clustered with an average linkage method, based on Pearson distances. Colors represent the Z-scores, calculated for each row based on the maximum and minimum gene expression level observed. Gills-specific genes are boxed, and the top 20 most highly expressed gill-specific protein-coding transcripts, defined by a fold change value > 10 in all the pairwise comparisons with the other available tissues, are shown in a table. TPM = Transcripts Per Million. * target genes for validation by qRT-PCR, see Supplementary Data Note 2.

