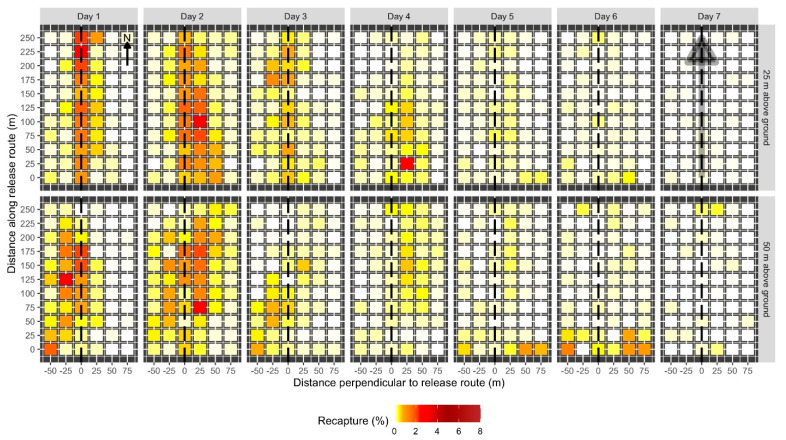
Figure 4.
Spatial pattern of daily male codling moth recaptures when released from 25 m (top row) or 50 m (bottom row) above ground. Each day and altitude combination was replicated 6 times. Each colored cell represents the mean percentage of moths recaptured at a given location on a given day on a 25 m × 25 m grid of pheromone-baited traps. The intensity of shading in the cell corresponds to percentage recapture (see legend). The dashed line indicates the location of the release route over the plot. Locations of each trap along the plot and the distance perpendicular to the release route in m are indicated on the axes. Recaptures are scaled such that the sum of all cells for all seven days for a given release height equals 100%. The arrow in the upper left panel indicates plot orientation relative to north. Prevailing winds were out of the north. The shaded gray arrow in the top right panel indicates the location and direction of the release route.

