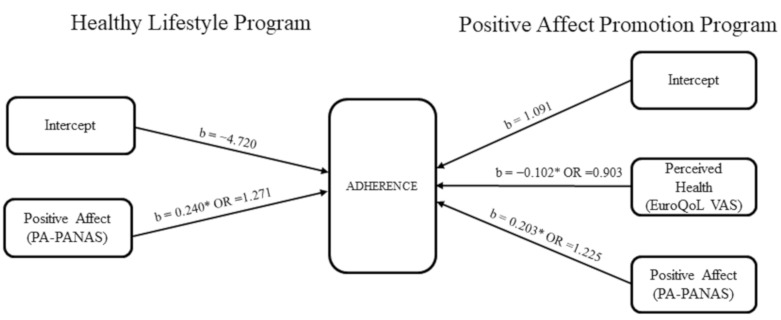
Figure 1.
Regression models for Healthy Lifestyle program and Positive Affect Promotion Program. Notes: Healthy Lifestyle model: R2 = 0.25 (Hosmer & Lemeshow), R2 = 0.295 (Cox & Snell), R2 = 0.394 (Nagelkerke). X2(1) = 16.11, p < 0.001; Positive Affect Promotion Model: R2 = 0.29 (Hosmer &Lemeshow), R2 = 0.336 (Cox & Snell), R2 = 0.449 (Nagelkerke). X2(1) = 16.358, p < 0.001. b: Regression coefficient; OR: Odds ratio; * p < 0.05 (based on 95% bootstrap confidence intervals based in 1000 samples).

