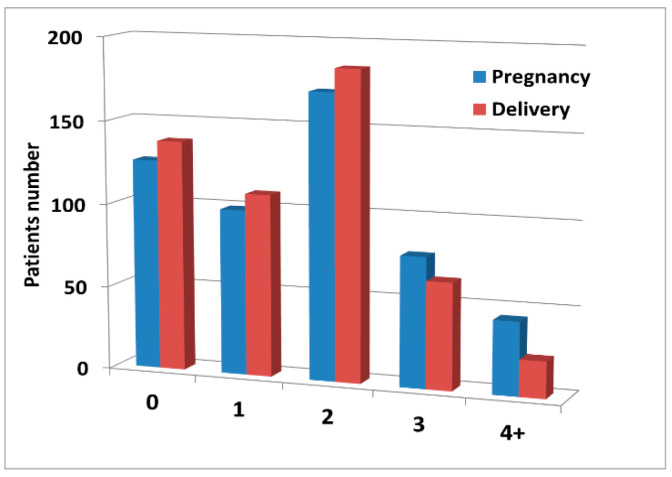
Figure 2.
The graph shows the number of patients (vertical axis) corresponding to the number of pregnancies (blue bars) or the number of deliveries (red bars) per individual, respectively (horizontal axis). “4+”: 4 or more. Note that the bars corresponding to the number of deliveries differ from the respective “Pregnancy” bars due to miscarriages.

