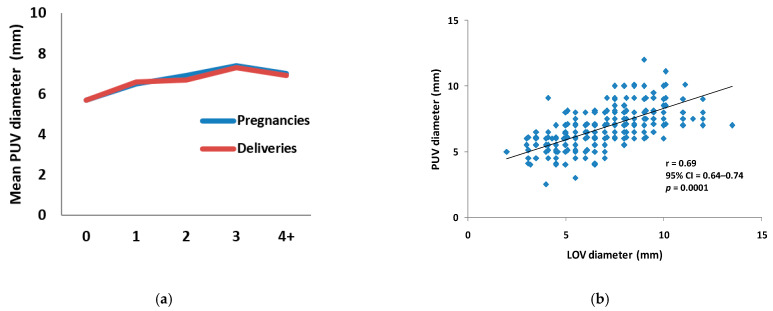
Figure 3.
Mean parauterine vein diameter. (a) The graph shows the mean diameters (in mm, vertical axis) of parauterine veins with regard to the number of pregnancies or deliveries, respectively (horizontal axis). (b) The graph shows the relationship between the diameters of left ovarian and parauterine veins. Each dot represents the respective measurements from a single individual. Abbreviations: LOV: left ovarian vein, PUV: parauterine veins, and “4+”: 4 or more.

