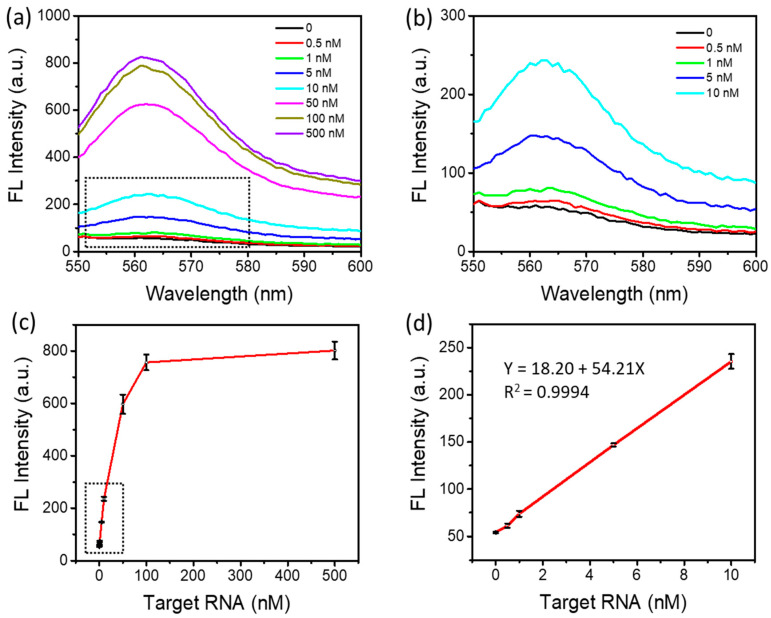
Figure 5.
SARS-CoV-2 RNA detection. (a) Fluorescence emission spectra with different target RNA concentrations. (b) An enlarged view of the black dotted box in (a) representing the fluorescence responses to target RNA at low concentrations. (c) Fluorescence intensity depending on the concentrations of target RNA. (d) Linear relationship between fluorescence intensity and the concentration of target RNA, an enlarged view of the black dotted box in (c).

