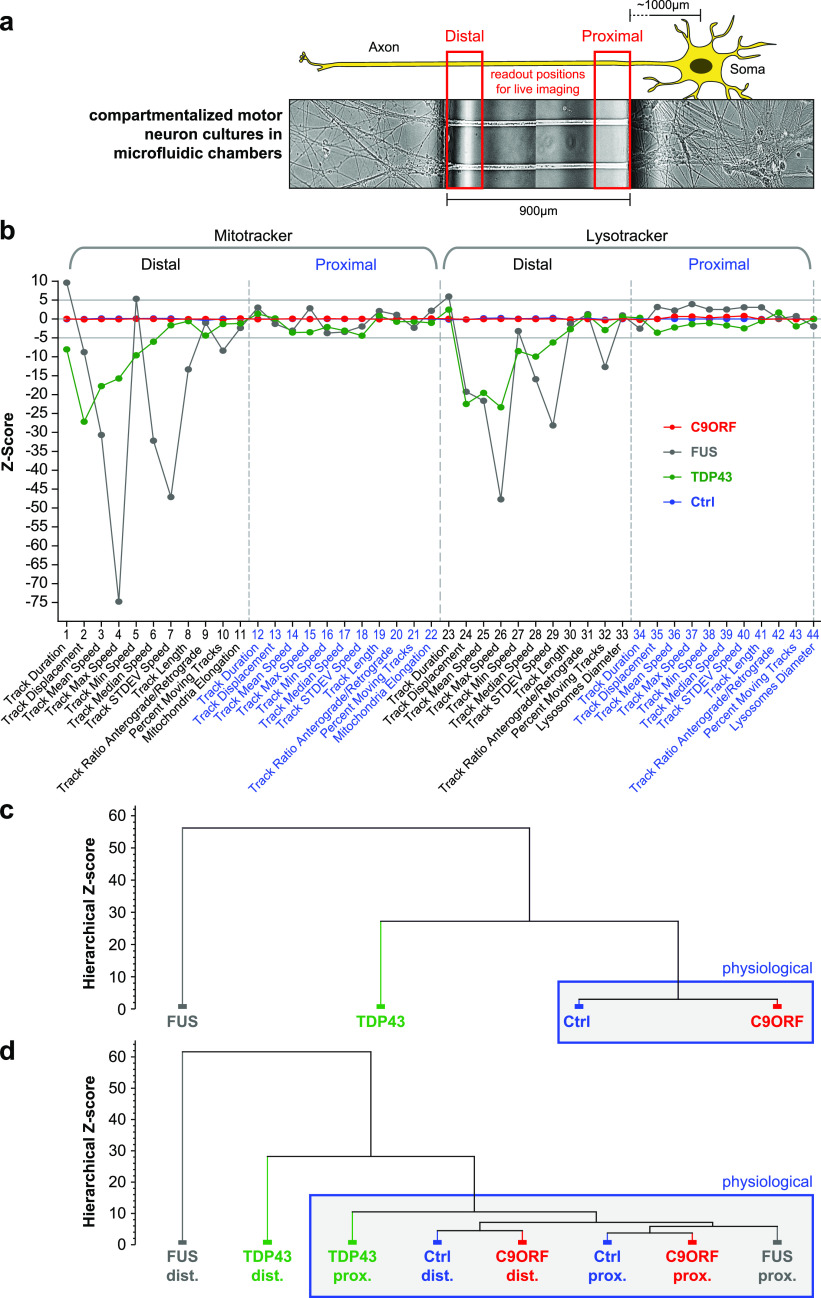
Figure 1. Multiparametric high-content phenotypic profiling revealed no phenotype in C9ORF72 at D21 of spinal MN maturation.
(A) Schematic live setup of motor neurons (MNs) in zona microfluidic chambers (MFCs). The central microgroove of channels formed a physical barrier between the distal (left) and proximal (right) site where the somata were seeded. Only axons, not dendrites, could penetrate the microchannels. (B) Multiparametric high-content signatures corresponding to the maximum intensity projections in Fig 2A, D21. Shown is the Z-score deviation of each tracking parameter from the proximal readout of pooled Ctrl lines (in blue). A set of 11 parameters (bottom labels) was deduced for both the Mito- and LysoTracker, distal versus proximal each, as indicated in the header, resulting in 44 parameters in total. The signatures of mutant FUS (in grey) and TDP43 (in green) were taken from our previous publication to facilitate the comparison to C9ORF (in red, pooled lines, for individual lines refer to Fig S2). Horizontal grey lines at 5 and −5 indicate significance thresholds. Note the nearly unaltered trafficking in FUS and TDP43 at the proximal readout as opposed to strong negative parameter deviations at the distal site in FUS distinct from the more modest phenotype of TDP43. Conversely, C9ORF exhibited a flat line similar to control lines, consistent with no phenotype at D21 (Fig 2A and C). (C) Hierarchical cluster dendrogram of entire signatures shown in (B). The hierarchical Z-score (ordinate) indicates the deviation of entire signatures from each other and is not to be mistaken with the individual parameter Z-scores in (B). Blue boxed cluster highlights physiological signatures. Note how the phenotypically unremarkable C9ORF (red) clustered with Ctrl (blue) against the deviate TDP43 (green) and more severe FUS mutant (grey). (D) Hierarchical cluster dendogram of partial signatures comprising either only all distal or proximal parameters (Mito- and LysoTracker, respectively) to compare site-specific phenotypes. Note how both Ctrl parts (blue; distal and proximal) clustered closely with the proximal FUS part (grey) on the right into a physiological super cluster boxed in blue because of the close physiological trafficking state, whereas the drastic organelle arrest in the distal FUS part on the far left (grey) was highly distinct to its physiological parts at the proximal site. TDP43 showed some moderate deviation in its proximal part (green) within the physiological super cluster and a clear deviation in its distal part (green), albeit less drastic than FUS (grey). C9ORF was contained in the physiological super cluster with both the distal and proximal parts because of no phenotype at D21.

