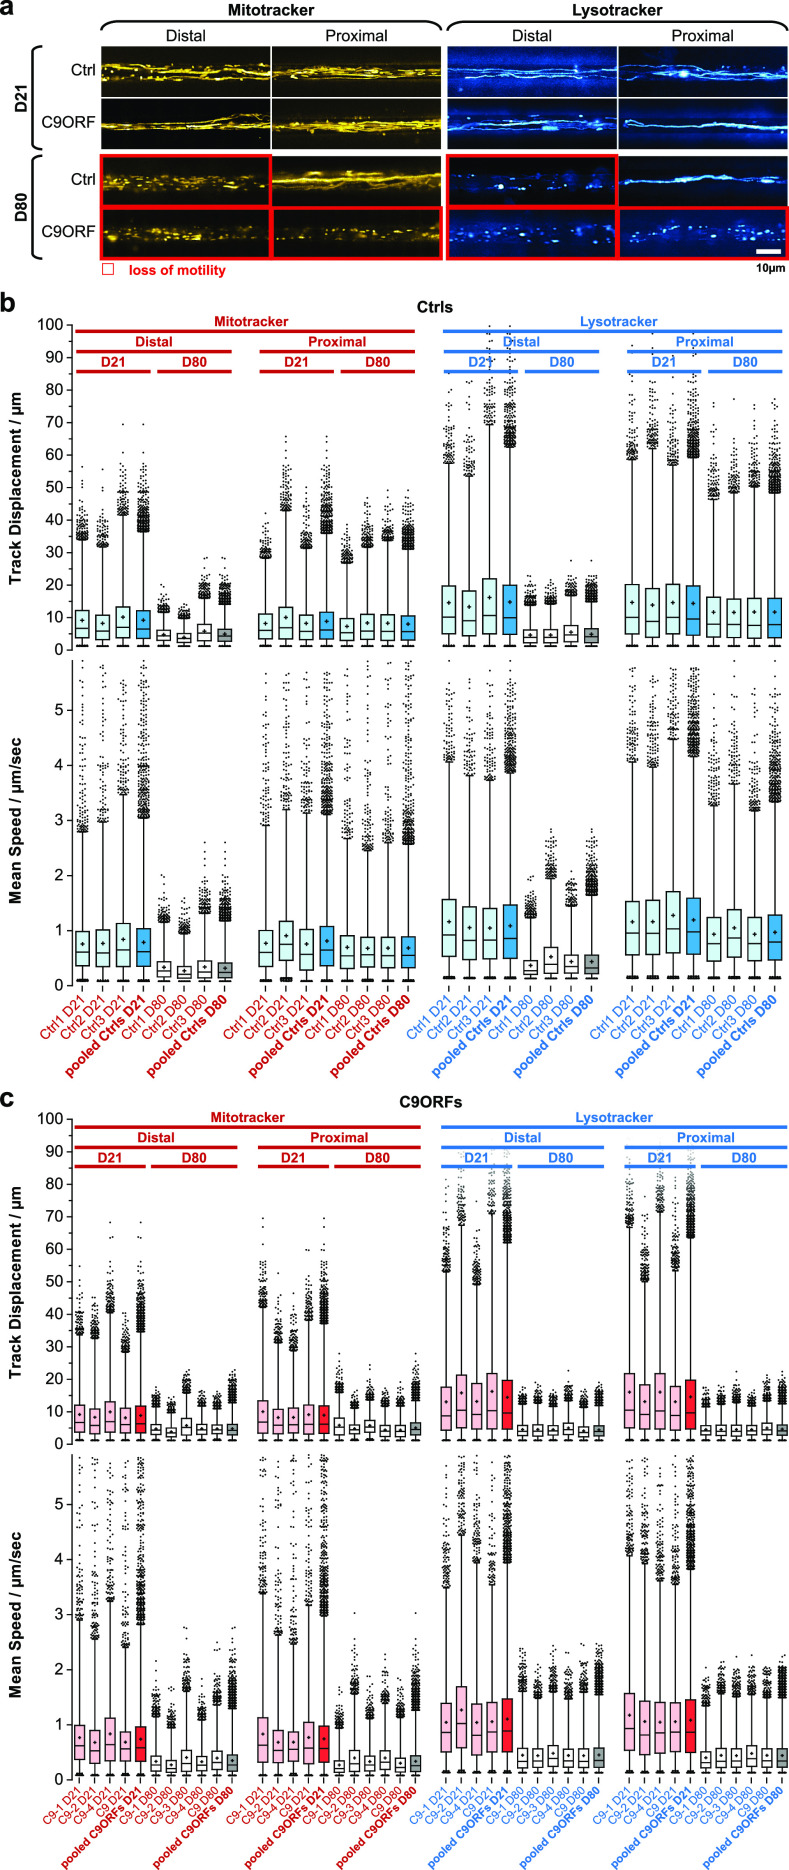
Figure 2. Loss of organelle motility in aged C9ORF72 spinal MNs.
(A) Maximum intensity projections of movie raw data acquired live with MitoTracker (left) and LysoTracker (right) at the distal (left) versus the proximal (right) microchannel readout position as shown in Fig 1A. Movies were acquired on day 21 during maturation (top galleries, D21) versus aged stage on D80 (bottom galleries). Red-boxed images highlight loss of motility. Note the loss of motility on D80 in both distal and proximal C9ORF axons as opposed to distal loss only in Ctrl neurons. Shown are the Ctrl2 and C9-1 lines (Table 2) as representative examples. An overview of all lines is provided in Fig S1. Scale bar = 10 μm. (B) Organelle tracking analysis corresponding to (A) of all Ctrl lines as box plots, MitoTracker (left), and LysoTracker (right) distal versus proximal and D21 versus D80 as indicated in the header. Whiskers: 1–99%, box: 50%, horizontal line: median, cross: mean, outliers: black dots. Shown are the individual Ctrl lines (Ctrl1–3, in pale blue or light grey) along with the pooled analysis (Ctrls pooled, in full blue or dark grey), as indicated in bottom labels. The tracking analysis was performed for organelle track displacement (top box plots) and mean speed (bottom box plots). Physiological motility is indicated in pale/full blue as opposed to organelle arrest in light/dark grey. Note that proximal motility remained physiological over ageing (D21 and D80) in all control lines as opposed to the distal decline on D80. (C) Same as (B) but for all C9ORF lines. Shown are the individual lines (C9-1, C9-2, C9-3, C9-4, and C9 in pale red or light grey) along with the pooled analysis (C9ORFs pooled, full red or dark grey), as indicated in bottom labels. Physiological motility is indicated in pale/full red as opposed to organelle arrest in light/dark grey. Note that both distal and proximal motilities were lost over ageing (compare D21 and D80) in all C9ORF lines, whereas proximal control organelles in (B) remained motile over ageing. C9-3 was not measured on D21.

