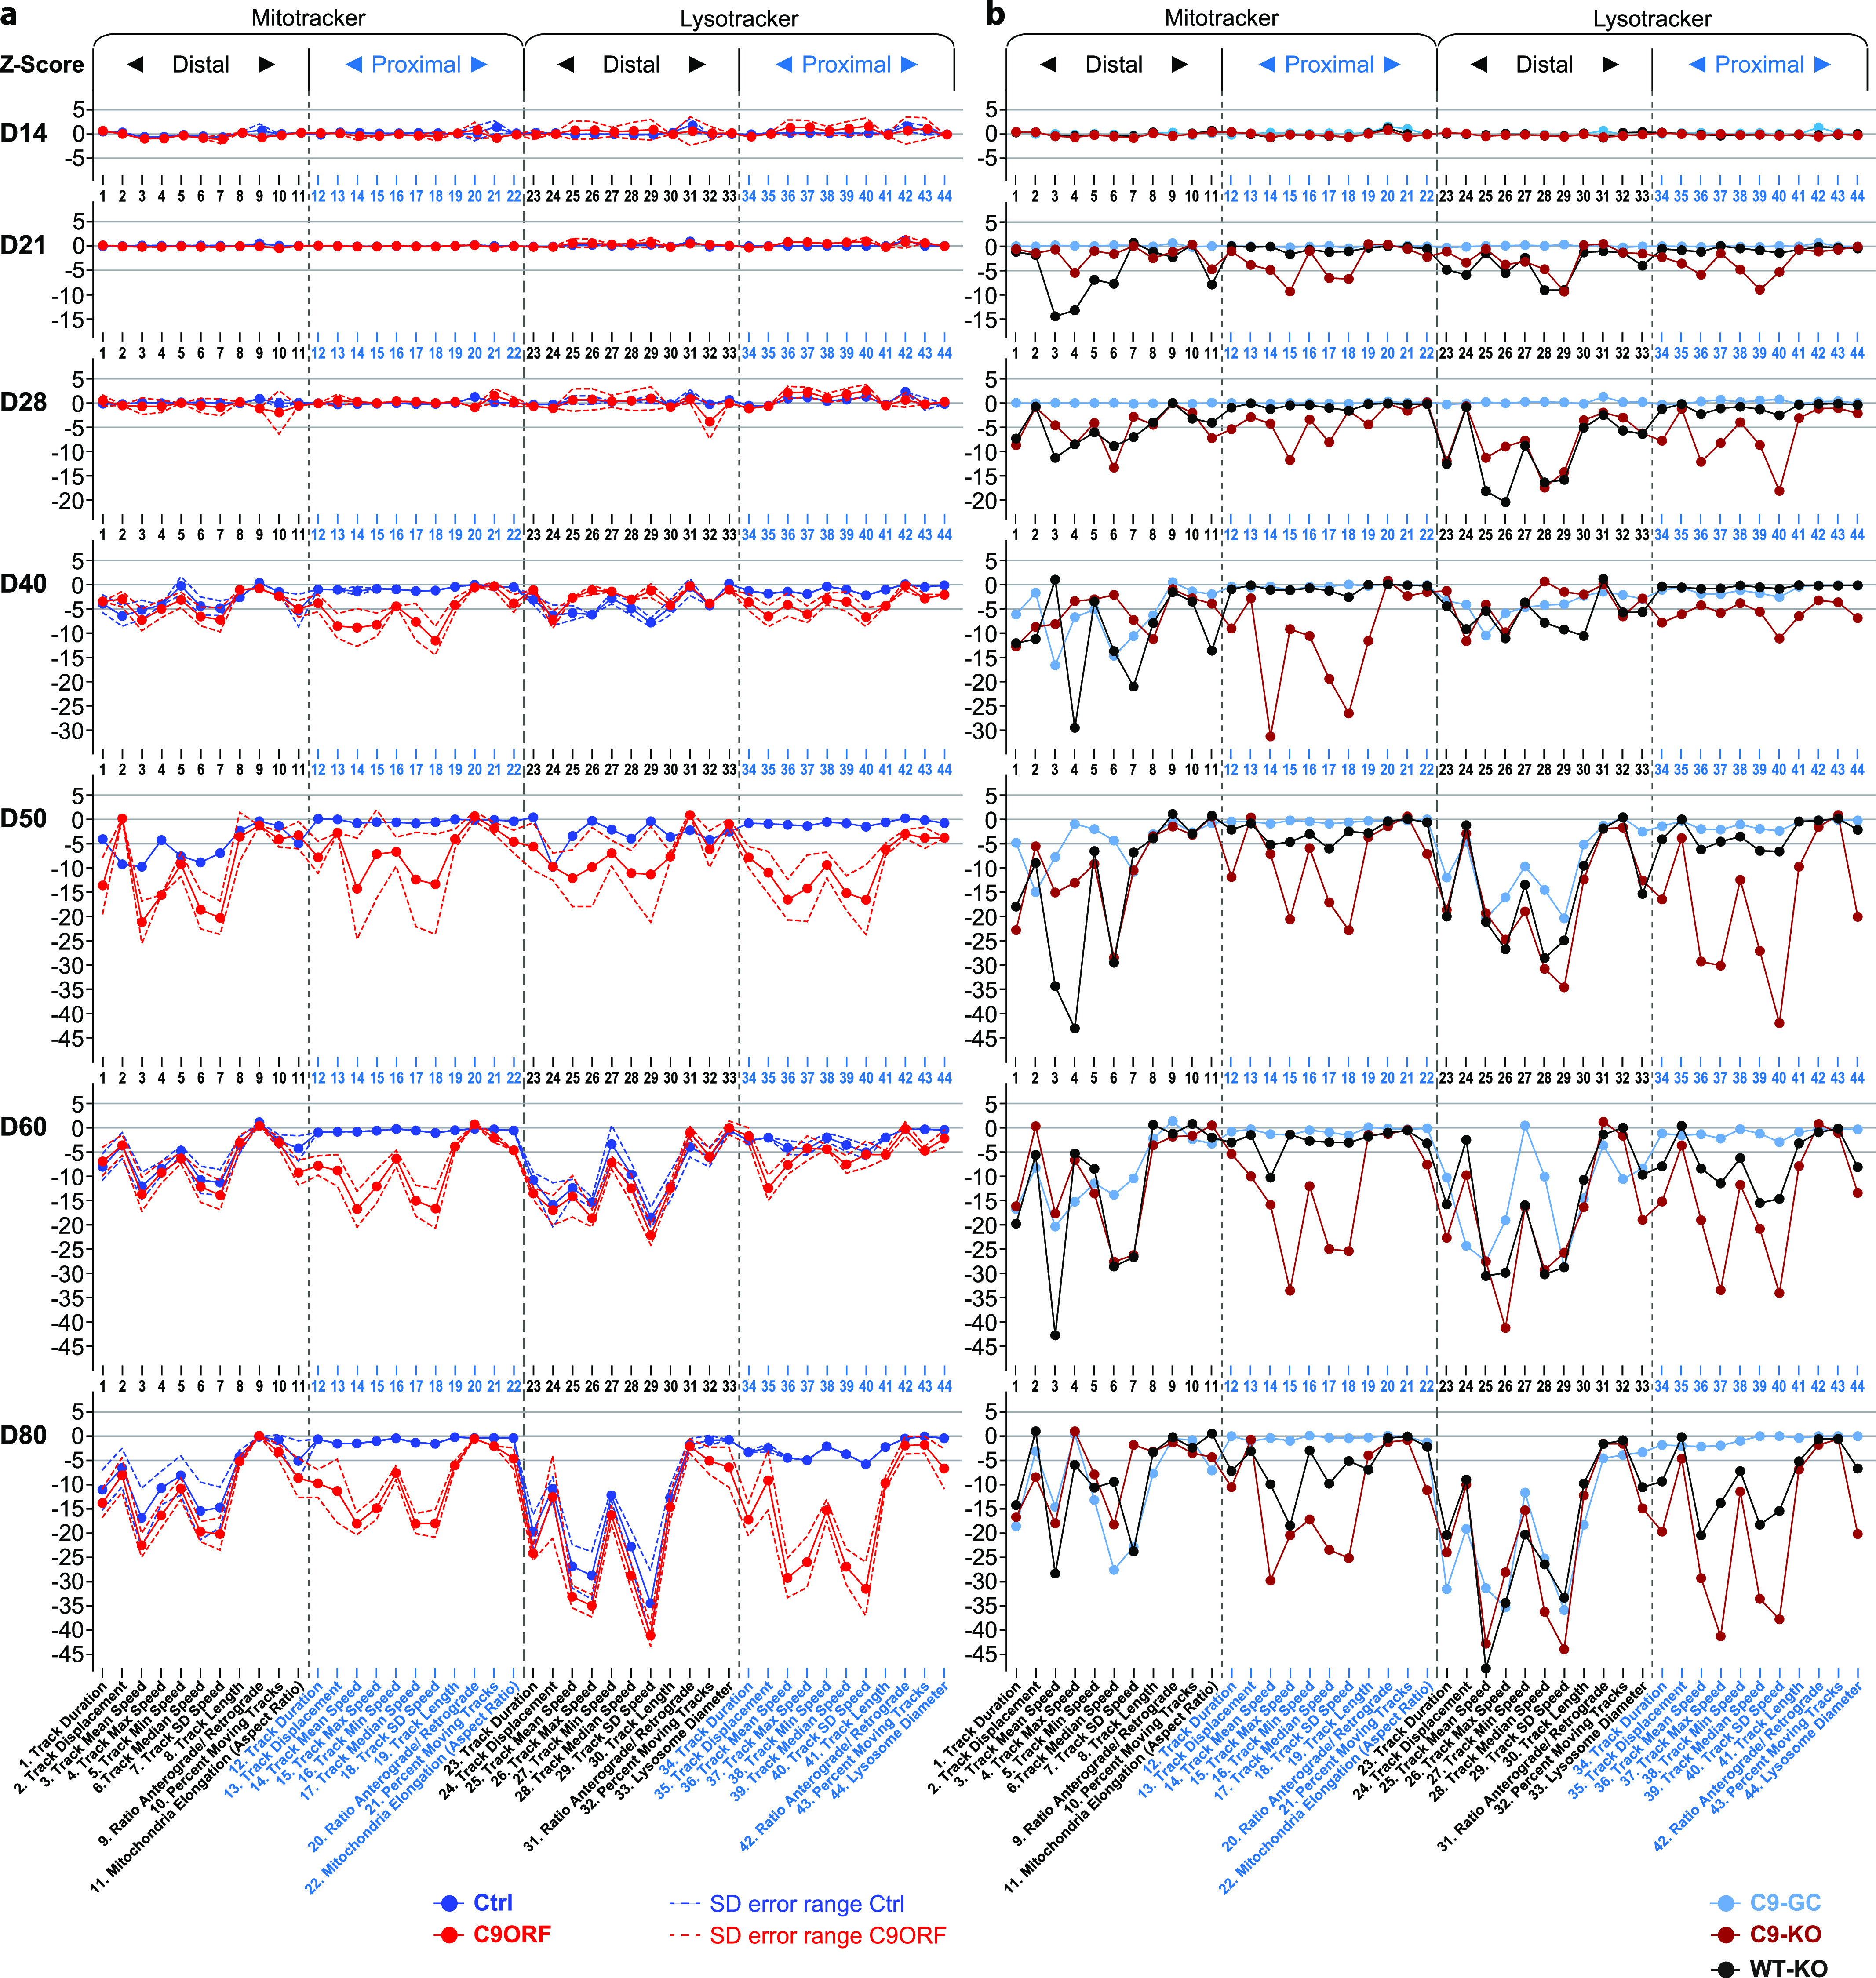
Figure 3. High-content phenotypic profiling over extended time course revealed global axonal trafficking defects in C9ORF72 spinal MNs over ageing.

(A) Multiparametric high-content profiles of pooled Ctrl (in blue) and C9ORF lines (in red) were deduced as in Fig 1B over a time course from D14 to D80, as indicated on the left. (For overview of all individual lines refer to Fig S2.) Z-scores for all time points were calculated with respect to pooled control lines at D21 proximal. Dotted lines indicate error ranges (SD between lines). Note the onset of trafficking decline (negative parameter deviations, and Z-scores ≤ −5) for either organelle type (Mito- and LysoTracker) from D40 onwards that progressed only at the distal readout site in control lines as opposed to the global phenotype in C9ORF72, that is, simultaneous emergence at both the distal and proximal sites. (B) Similar time course for (i) C9-GC with excised intronic hexanucleotide repeat expansions (HREs) (in light blue), (ii) C9-KO with intronic HREs preserved but with KO of the exonic C9ORF72 part (in brown), and (iii) WT-KO cells with the same exonic KO and naturally having no intronic HREs (in black). Note how the proximal trafficking decline in C9-GC was restored to physiological levels over the entire time course, whereas the distal decline remained unaltered (compare light blue profiles with dark blue counterparts in (A)). As for C9-KO, note the earlier onset of global (distal and proximal) trafficking defects already on D21 (Z-scores ≤ −5) compared with D40 in parental C9 (compare brown profiles with red counterparts in (A)). As for WT-KO, note the earlier onset of distal trafficking defects already on D21 and the emergence of a proximal decline at later time points as well (from D50 onwards) as opposed to distal decline only in parental Ctrl (compare black profiles with dark blue counterparts in (A)).
