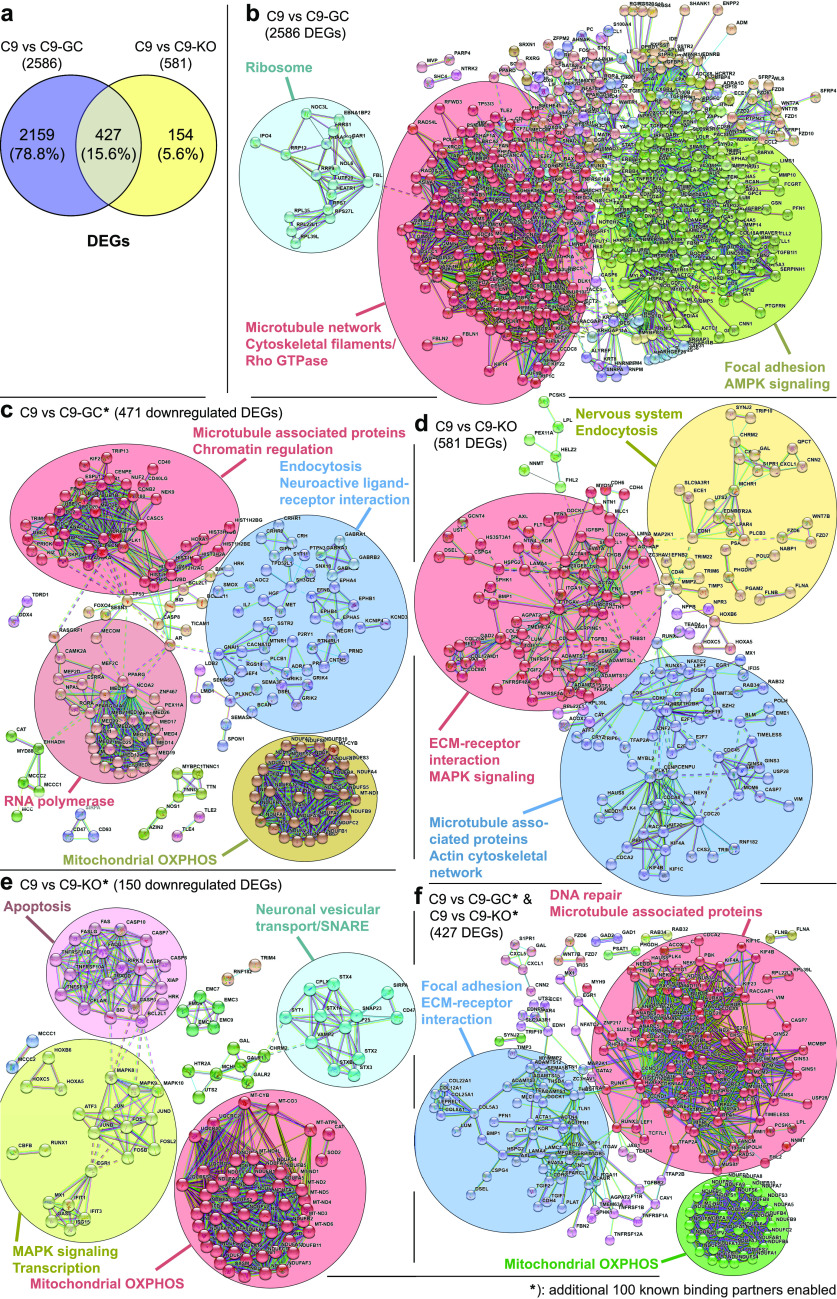
Figure 4. Identification and functional clustering of differentially expressed genes (DEGs) from high-throughput RNA-seq data sets.
(A) Venn diagrams showing the number of DEGs between C9 versus C9-GC spinal MNs (purple), between C9 versus C9-KO (yellow), and the observed overlap of both comparisons (kahki). (B, C, D, E, F) Protein–protein interaction (PPI) network analysis of the DEGs in C9 versus C9-GC (B, C), C9 versus C9-KO (D, E) and the common DEGs shared by both comparisons (F), as illustrated in (A). The nodes (bubbles) indicate the DEGs and the connecting lines the interaction between two proteins. The STRING database (Szklarczyk et al, 2019) was used to establish the interaction network, with a highest confidence score of >0.9 (STRING scores > 0.900). MCL clustering (inflation = 1.5) was applied on the PPI network to select most significant functional clusters or subnetworks. Clusters of functionally related nodes were manually encircled and annotated. Disconnected nodes were omitted. Statistical significance of P-value < 0.05 was applied in the network. (Refer to Tables S1–S5 for complete list of nodes.) (B) PPI network analysis of 2,586 DEGs C9 versus C9-GC, as illustrated in (A) revealed three functional clusters of hexanucleotide repeat expansion (HRE)–mediated, disease-specific interacting partners. Given the high number of seed proteins, a zero-order interaction network was performed using the NetworkAnalyst tool (Xia et al, 2015). No additional known interactors were enabled. (C) Further refinement of (B) restricted to 471 down-regulated DEGs and with 100 additional known interactors enabled (i.e., 50 direct “first shell” and 50 indirect “second shell” interactors, see the Materials and Methods section for details) revealed four functional clusters. (D) PPI network analysis of 581 DEGs C9 versus C9-KO as illustrated in (A) without additional known interactors revealed three functional clusters of C9ORF72 LOF-mediated interacting partners. (E) Further refinement of (D) restricted to 150 down-regulated DEGs and with 100 additional known interactors enabled revealed four functional clusters. (F) PPI network analysis of 427 DEGs shared by both comparisons (C9 versus C9-GC and C9 versus C9-KO), as illustrated in (A) with 100 additional known interactors enabled revealed three common functional clusters. (B, C, D, E, F) Summary and conclusion: note the identification of cytoskeletal- (mostly microtubule) related functional clusters in both HRE- (B, C) and LOF-mediated DEGs (D) of which many were shared by both comparisons (F), thereby pointing to a common, systemic microtubule-based underlying cause of axonal trafficking defects (Fig 3) that affects several organelle types in the same way. (C, E, F) Likewise, further refined PPI network analysis (C, E) revealed functional clusters for mitochondrial oxidative phosphorylation (OXPHOS) for both HRE- (C) and LOF-mediated (E) DEGs of which many were shared by both comparisons (F), thereby pointing to a common, systemic energy deprivation as further underlying cause of axonal trafficking defects (Fig 3).

