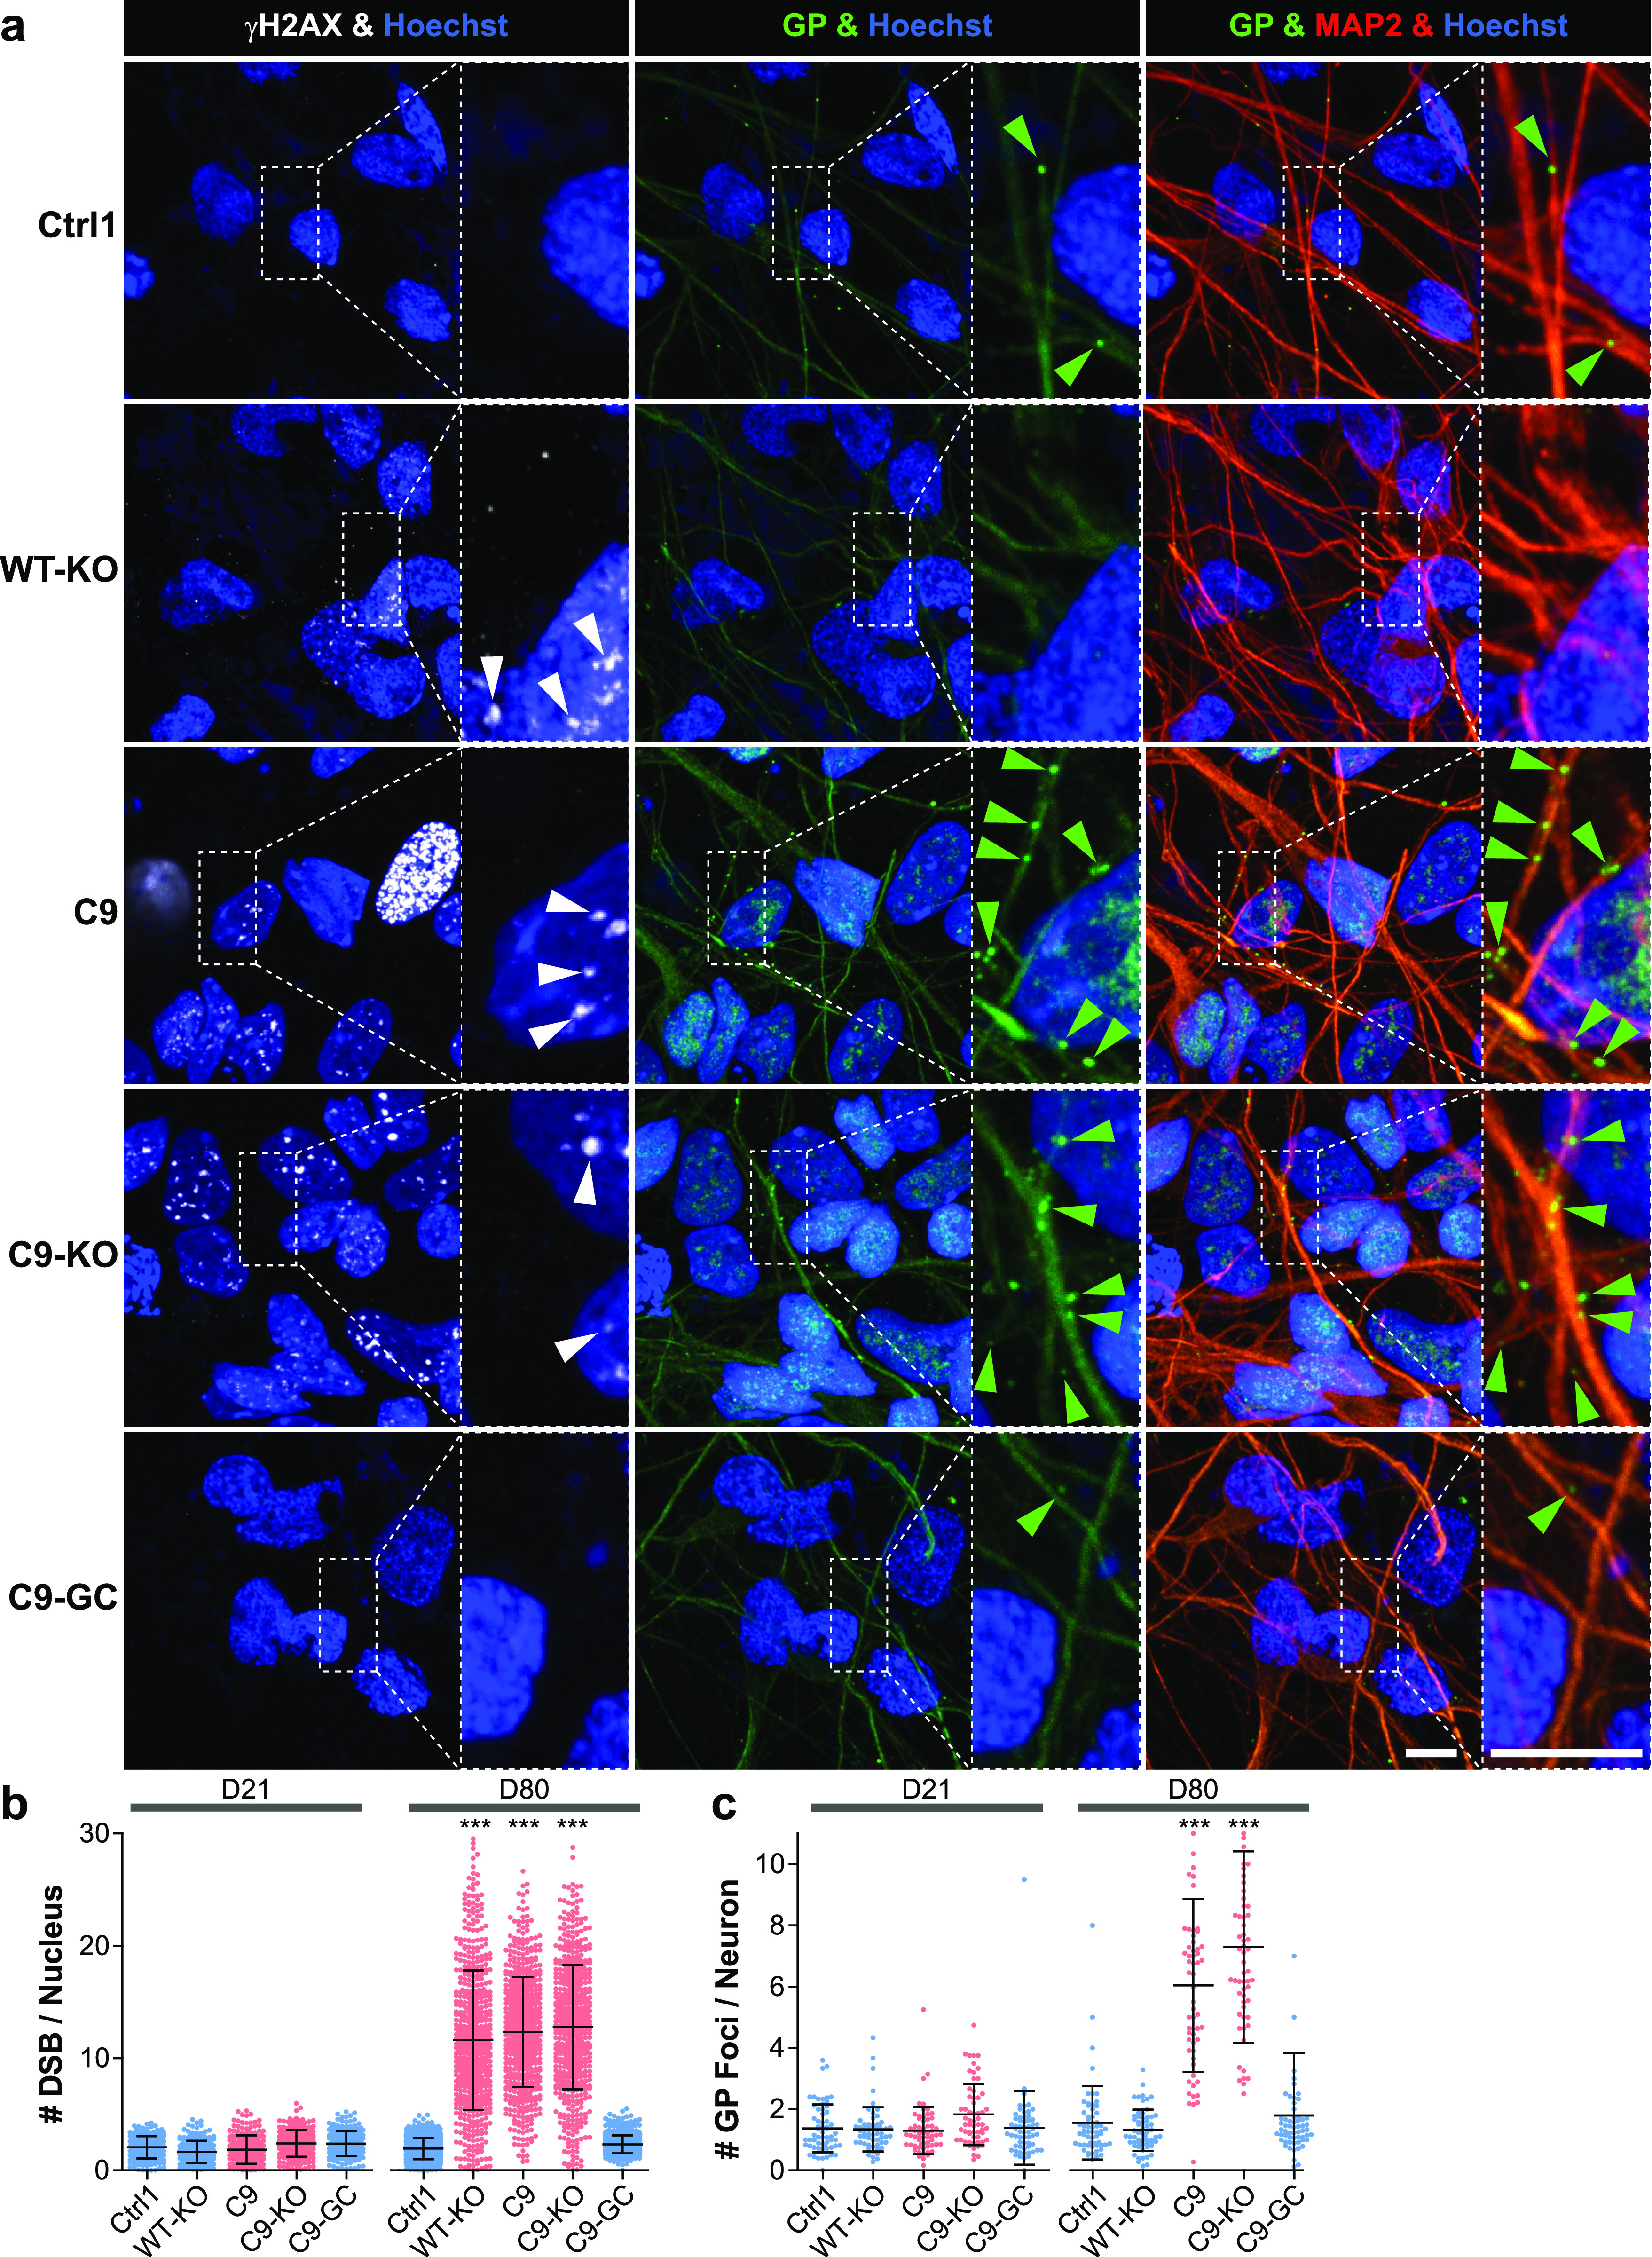
Figure 5. DNA damage accumulation concurred with neuritic glycine–proline (GP) dipeptide repeat protein foci in C9ORF72 spinal MNs over ageing.

(A) DNA double-strand break (DSB) marker γH2AX (in white) in Hoechst-positive nuclei (in blue) and neuritic GP foci (in green) in MAP2-positive neurons (in red) were revealed by confocal IF microscopy at D80 endpoints (Fig 3). Dotted boxed areas in image galleries are shown magnified on the right. Note the striking nuclear accumulation of γH2AX-positive nuclear foci (white arrowheads) in parental C9 and C9-KO that were phenocopied by WT-KO. Furthermore, GP foci aligned to neurites (green arrowheads) concurred with nuclear γH2AX accumulation in C9 and C9-KO. Conversely, DSBs and GP foci were nearly absent in C9-GC and parental Ctrl1. Arrowheads point only to arbitrary examples. Scale bars = 10 μm. (B) Quantification of DSBs in (A) in MAP2-positive neurons (count of γH2AX-positive foci per nucleus) on D21 versus D80 displayed as scatterplots of individual nuclear foci counts with mean (center line) and SD range (whiskers) indicated in black. (For images at D21 endpoint refer to Fig S6.) Note nearly absent DSBs on D21 in all lines versus drastic DSB accumulation on D80 in parental C9, C9-KO, and WT-KO. (C) Quantification of (A), number of neuritic GP foci in MAP2-positive neurons on D21 versus D80 displayed as scatterplots of foci counts per neuron and image. (For images at D21, refer to Fig S6.) Note nearly absent GP foci in all lines at D21 versus aligned foci at D80 endpoint in parental C9 and C9-KO. (B, C) Asterisks: highly significant increase in any pairwise comparison with unlabeled conditions, one-way ANOVA with the Bonferroni post hoc test, *P ≤ 0.05, **P ≤ 0.01, ***P ≤ 0.001, N = 60 images from three independent experiments, error bars = SD. All unlabeled conditions (i.e., with no asterisk) were not significantly different among themselves in any pairwise comparison.
