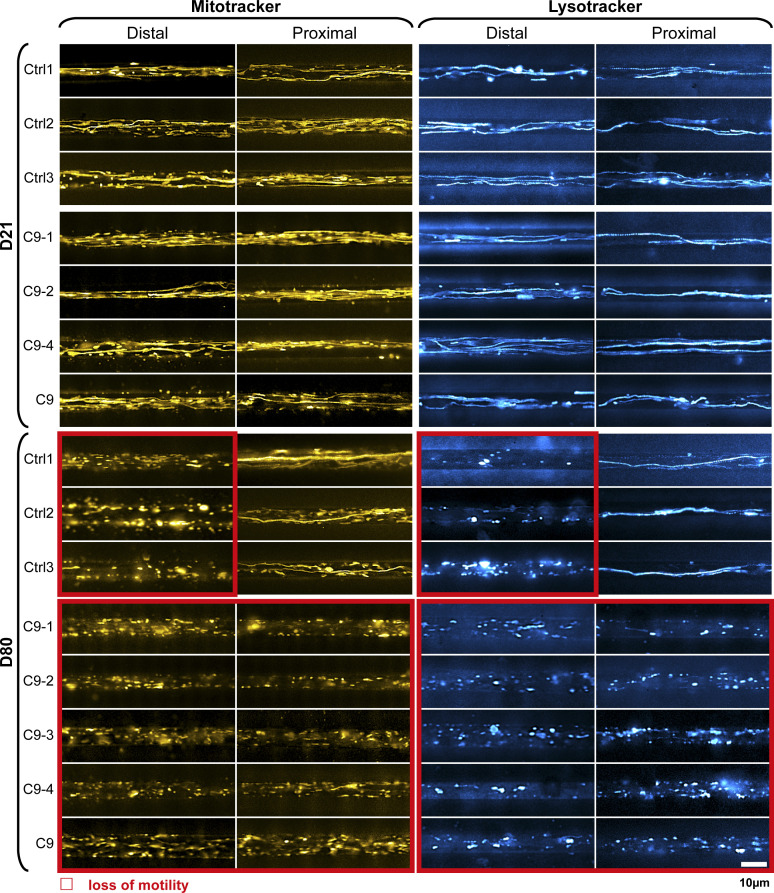
Figure S1. Loss of organelle motility in aged C9ORF72 spinal MNs.
Overview of all lines (Ctrls and C9ORFs, Table 1, corresponding to Fig 2A). Maximum intensity projections of movie raw data acquired live with MitoTracker (left) and LysoTracker (right) at the distal (left) versus the proximal (right) microchannel readout position, as shown in Fig 1A. Movies were acquired on day 21 during maturation (top galleries, D21) versus aged stage on D80 (bottom galleries). Red boxed images highlight loss of motility. Note the loss of motility on D80 simultaneously in both distal and proximal C9ORF axons as opposed to distal loss only in Ctrls. C9-3 was not measured at D21. Scale bar = 10 μm.

