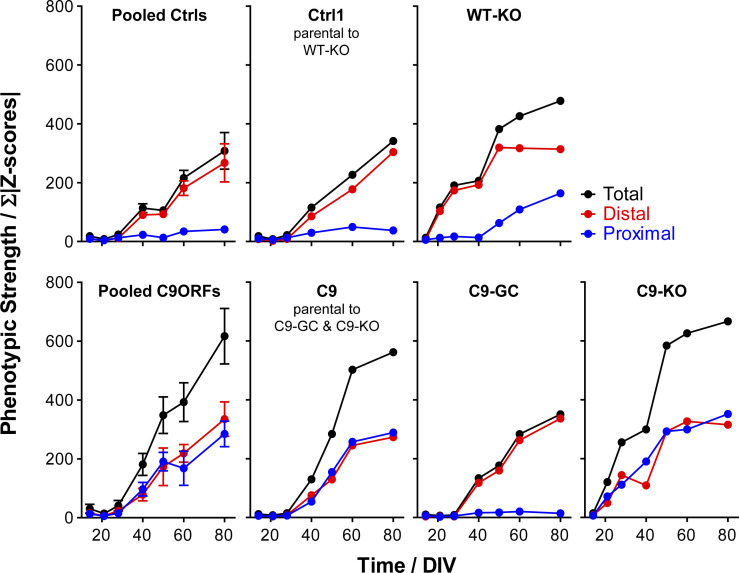
Figure S3. Phenotypic strength progressing over time.
The sum of all Z-score moduli of profiles in Fig 3 was plotted as measure of phenotypic strength over time to highlight the progression of declining trafficking. Black curves: entire profile, blue curves: only proximal profile parts, red curves: only distal profile parts. Note how unaltered control cells remained nearly constant on the initial baseline level over the entire time course at the proximal site because of no phenotype (top gallery, pooled Ctrls, and Ctrl1 parental to WT-KO in blue), whereas their phenotypic strength at the distal site exhibited a sudden increase from D40 onward due to the onset of trafficking decline (top gallery, Pooled Ctrls and Ctrl1 in red). Conversely, WT-KO exhibited a proximal trafficking decline from D50 onward along with an earlier onset of distal phenotypes already at D21 as compared with D40 in parental Ctrl1 (top gallery). As for parental C9, phenotypic strength exhibited a sudden increase from D40 onward simultaneously at both the distal and proximal site due to the onset of a global trafficking decline (bottom gallery, Pooled C9ORFs and C9). C9-GC showed a complete absence of the proximal increase in phenotypic strength because of restoration of trafficking at this site, whereas the distal decline remained as in Ctrl cells (bottom gallery, C9-GC). Conversely, C9-KO exhibited an earlier onset of increasing phenotypic strength simultaneously at both the distal and proximal sites already on D21 as opposed to D40 in parental C9 (bottom gallery, compare C9-KO with C9).

