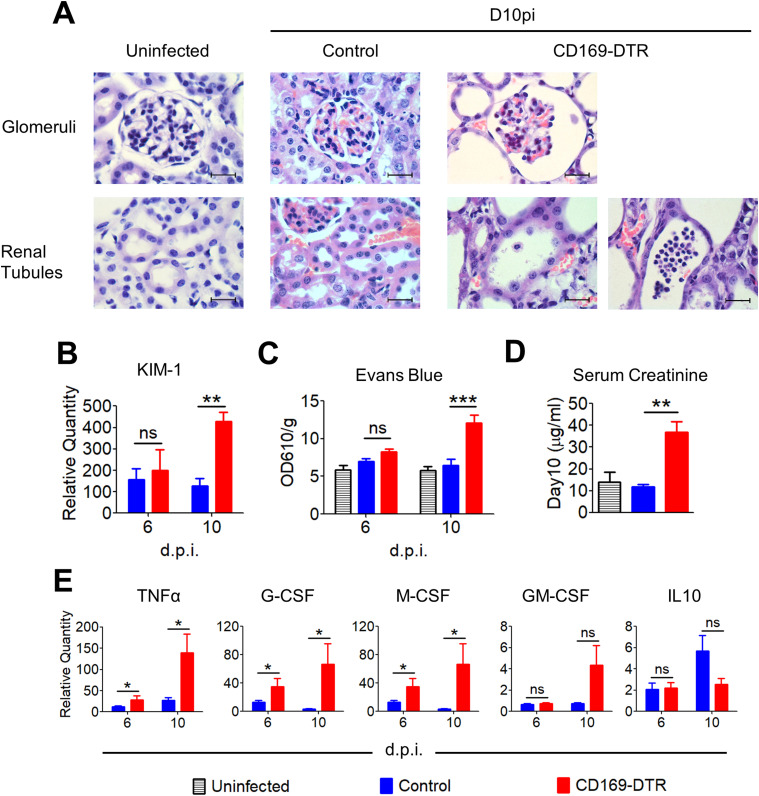
Figure 3. CD169-DTR mice suffered from progressive kidney damage, inflammation, and compromised renal function.
(A) Representative micrographs of H&E–stained paraffin sections of uninfected (day 0) and infected (day 10) kidneys of control and CD169-DTR mice. Magnification, 1,000×. Scale bar, 20 μm. (B) Relative mRNA expression levels of Kim-1 in infected kidneys, measured by quantitative RT-PCR. Data are normalized to β-actin. t test (two-tailed). (C) Vascular permeability was measured by Evans blue extravasation, calculated from absorbance readings at OD610. Data are normalized to organ weight (g). One-way ANOVA (Bonferroni’s multiple comparisons test). (D) Serum creatinine (micrograms per milliliter), measured on day 10 after infection. t test (two-tailed). (E) Relative expression levels of TNFα, G-CSF, M-CSF, GM-CSF, and IL10 in kidneys, measured by quantitative RT-PCR. Data are normalized to β-actin. t test (two-tailed). Data are shown as mean ± SEM. *P < 0.05. **P < 0.01. ***P < 0.001. ns, not significant. Data represent two (n = 3) independent experiments.

