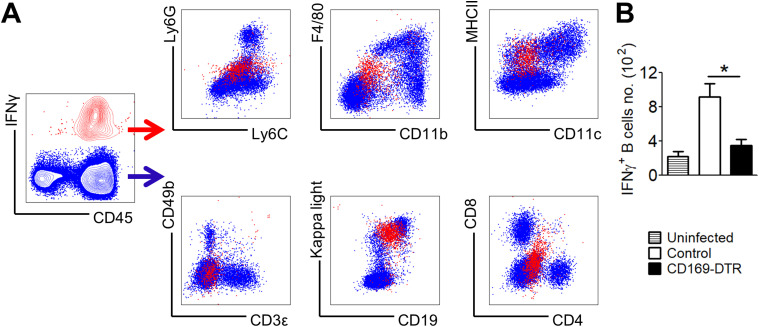
Figure 7. Candida-induced renal IFNγ is not produced by classical IFNγ-producing cells.
IFNγ-producing cells were analyzed in infected WT and CD169-DTR kidneys at day 6 p.i. (A) Contour plot of kidney cells stained for IFN-γ and CD45 (left). Expression profile of a panel of surface markers by IFNγ+ cells (red dots) and IFNγ− cells (blue dots). IFNγ+ cells can be identified as Ly6CintLyGlo, F4/80loCD11blo, MHCII+CD11clo, CD49bnegCD3neg, kappa-light chain+CD19int, and CD8negCD4neg. (B) Absolute number of IFNγ+ kappa-light chain+CD19int cells in kidneys isolated from uninfected, infected, control and CD169-DTR mice (day 6 p.i.). t test (two-tailed). *P < 0.05.

