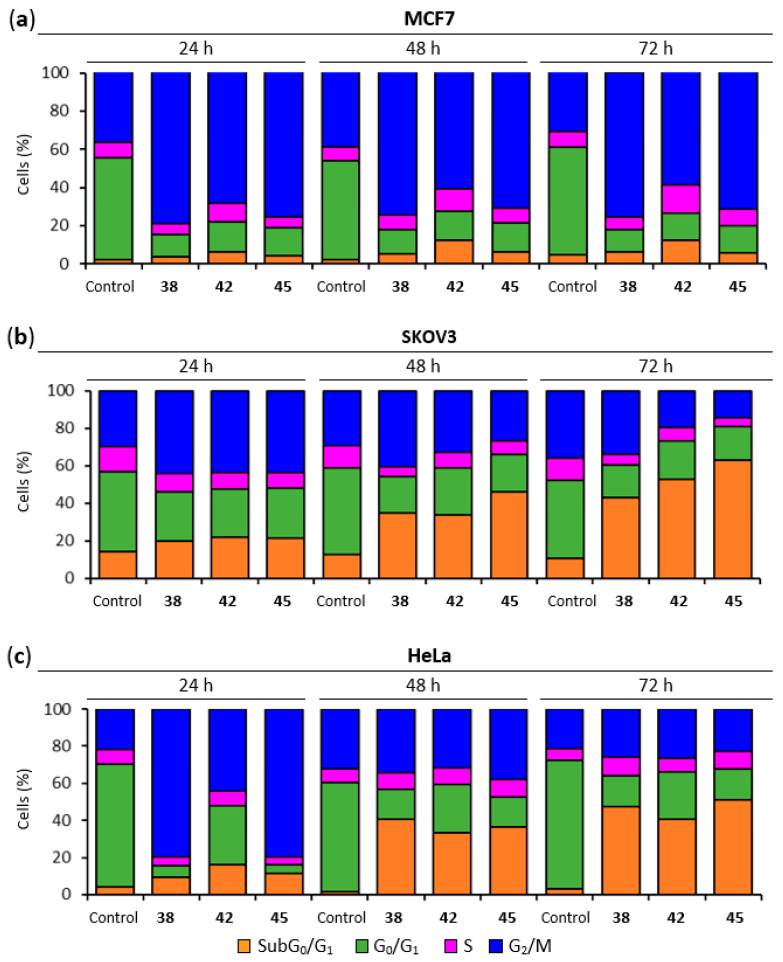
Figure 3.
Cell cycle analysis. (a) MCF7 cell cycle distribution. Cells were arrested in G2/M phase. (b) SKOV3 cell cycle distribution. Cells arrested in G2/M phase experienced time-dependent cell death (SubG0/G1 region). (c) HeLa cell cycle distribution. Cells were arrested in the G2/M phase followed by cell death (SubG0/G1 region). Cells were incubated with the lead compounds at 600 nM (38), 50 nM (42), or 400 nM (45) for 24, 48, and 72 h, stained with propidium iodide (PI) and their DNA content was analyzed by flow cytometry. Untreated samples were analyzed in parallel. The different cell cycle populations were quantified, expressed in percentages, and represented in bar charts. Data shown are representative of three independent experiments.

