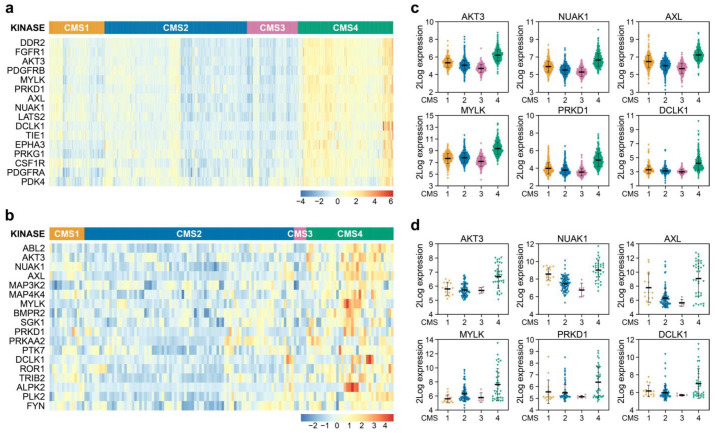
Figure 1.
Identification of differentially expressed kinases in CMS4 versus CMS1-3 samples. (a,b) Heatmaps depicting Z-score transformed 2Log expression of kinases significantly differentially expressed in CRC patient samples (a) and (primary) cell lines (b); (c,d) 2Log mRNA expression levels of kinases differentially expressed between subtypes in both patient samples (c) and (primary) cell lines (d) as determined by microarray or RNAseq.

