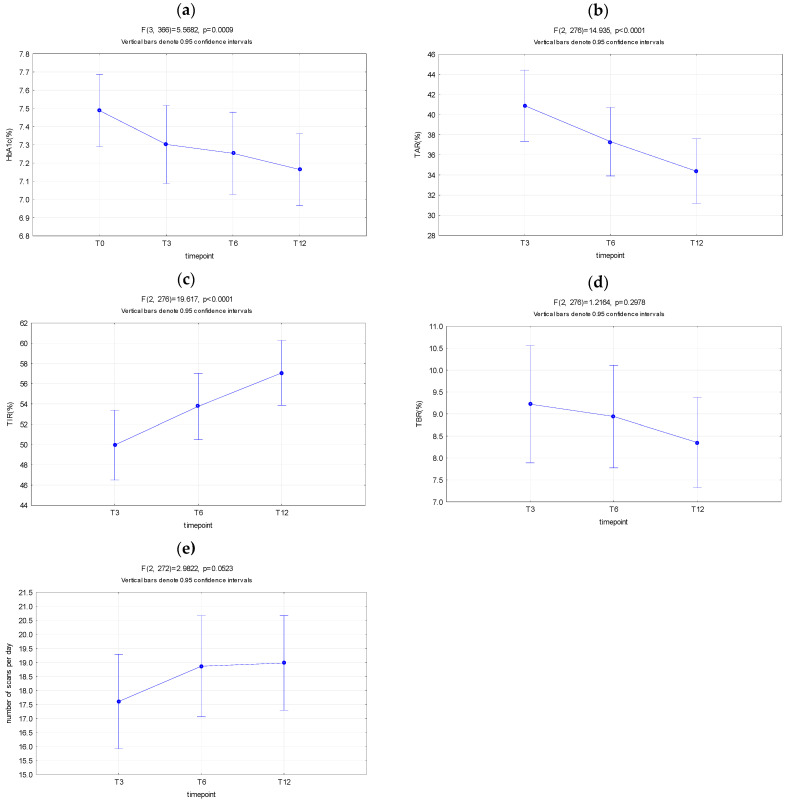
Figure 1.
HbA1c, TAR, TIR, TBR, and number of scans over time in the entire cohort. (a) HbA1c values significantly decreased from baseline (T0) to 3 months (T3), while no change was observed afterwards. (b) Time above range (TAR) decreased significantly over time from T3 to T12. (c) Time in range (TIR) increased significantly over time from T3 to T12. (d) There was no change in time spent in hypoglycemia (TBR; time below range) over time from T3 to T12. (e) Number of scans per day remained similar from T3 to T12, no significant change was observed.

