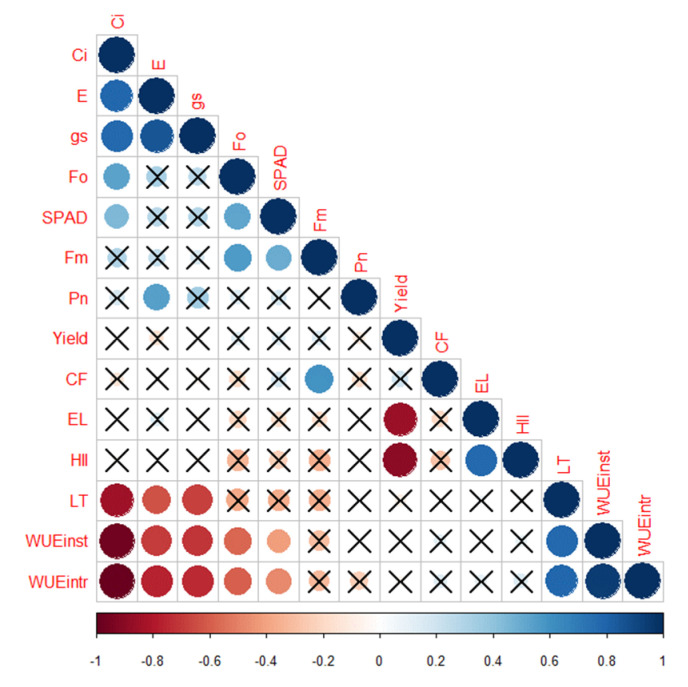
Figure 7.
Correlogram showing the relationship between average values of the variables in open-field conditions. The intensity of color and size of the circle increases with an increase in the significance of correlation. Dark red denotes a high negative correlation, whereas dark blue denotes a high positive correlation. The cells with cross marks denote no significant correlation between the variables. The full form of abbreviations used in the correlogram are given in the abbreviations section.

