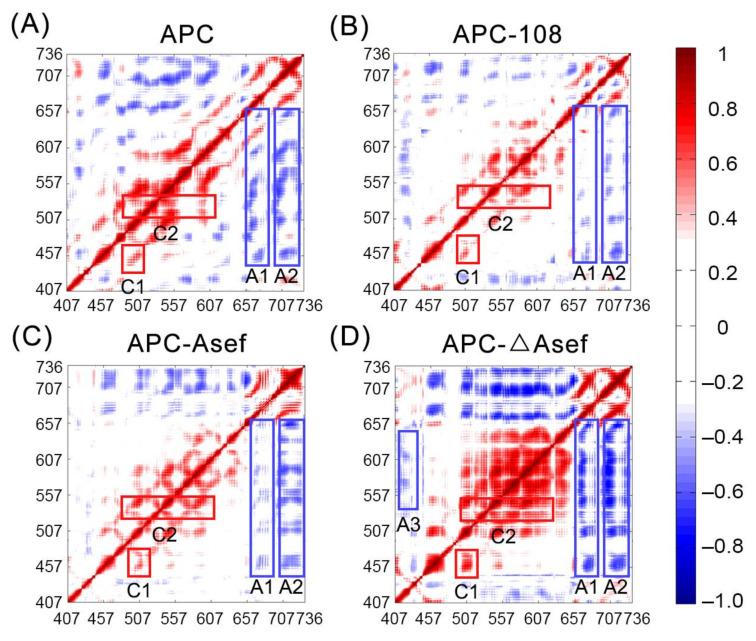
Figure 6.
The dynamic cross-correlation matrixes (DCCM) of APC (A), APC-108 (B), APC-Asef (C), and APC-ΔAsef (D). Red rectangles (C1–C2) show important correlated areas, while blue rectangles (A1–A3) show areas with clear anti-correlations. The interactions with an absolute correlation coefficient of less than 0.3 are colored white for clarity.

