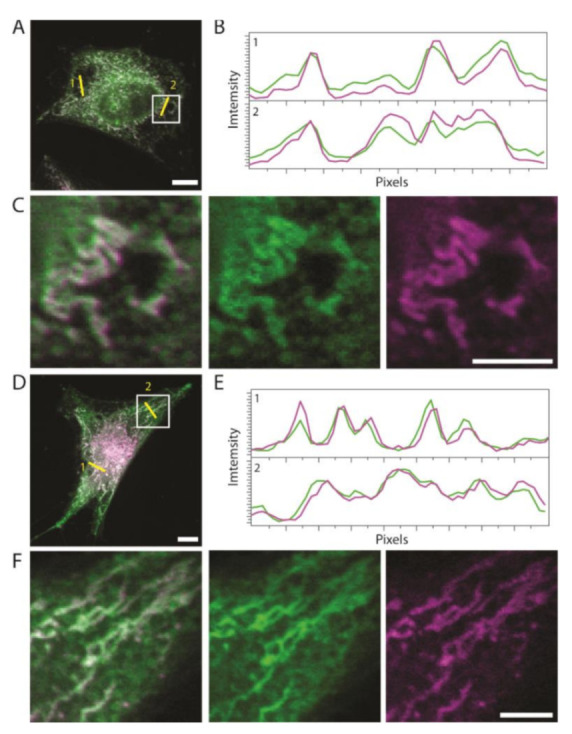
Figure 1.

Dual-color confocal microscopy of 1 (A–C) and 2 (D–F) in formaldehyde-fixed HeLa cells. (A,D) Overlaid images of the dye (green) and MT (purple). Scale bars represent 10 μm. (B,E) Intensity profile traces extracted from the yellow lines in A,D. (C,F) Magnified image of the area in the white square, showing the two color channels split. Scale bars represent 5 μm.
