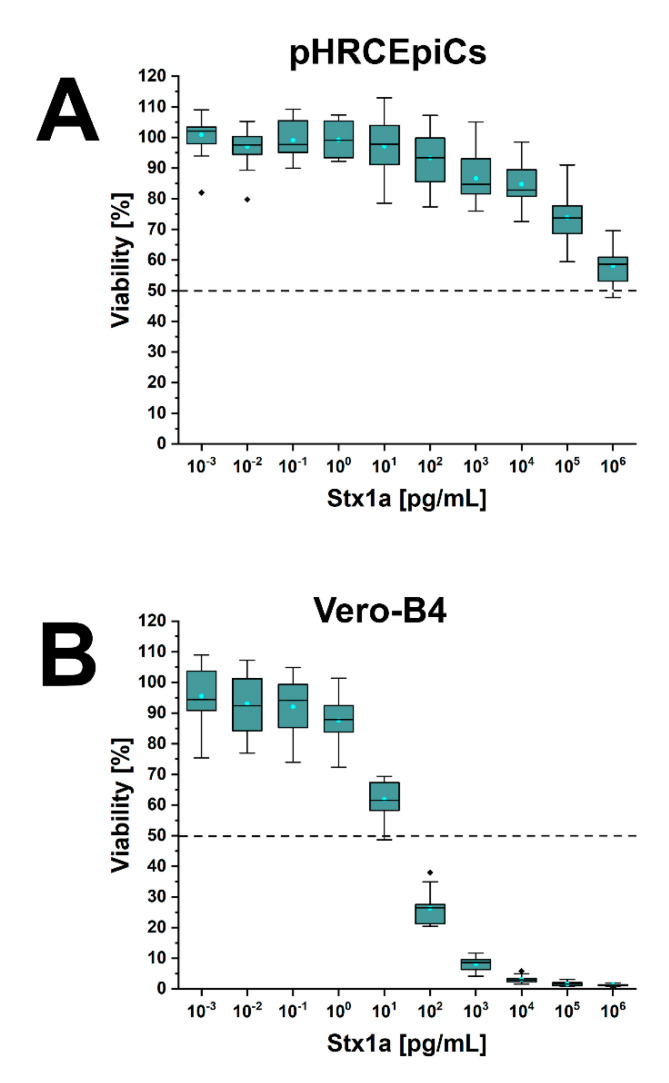
Figure 6.
Cytotoxic action of Stx1a towards pHRCEpiCs (A) and Vero-B4 reference cells (B). Cytotoxicity was determined using the crystal violet assay, and absorption readings obtained from Stx1a-treated cells are displayed as a box plot diagram providing percentage values related to 100% viability of parallel cell cultures without toxin. Measurements of three biological replicates were performed as six-fold determinations. The 18 data points per toxin concentrations are portrayed as triangles, the medians as solid lines, and the means as dashed lines.

