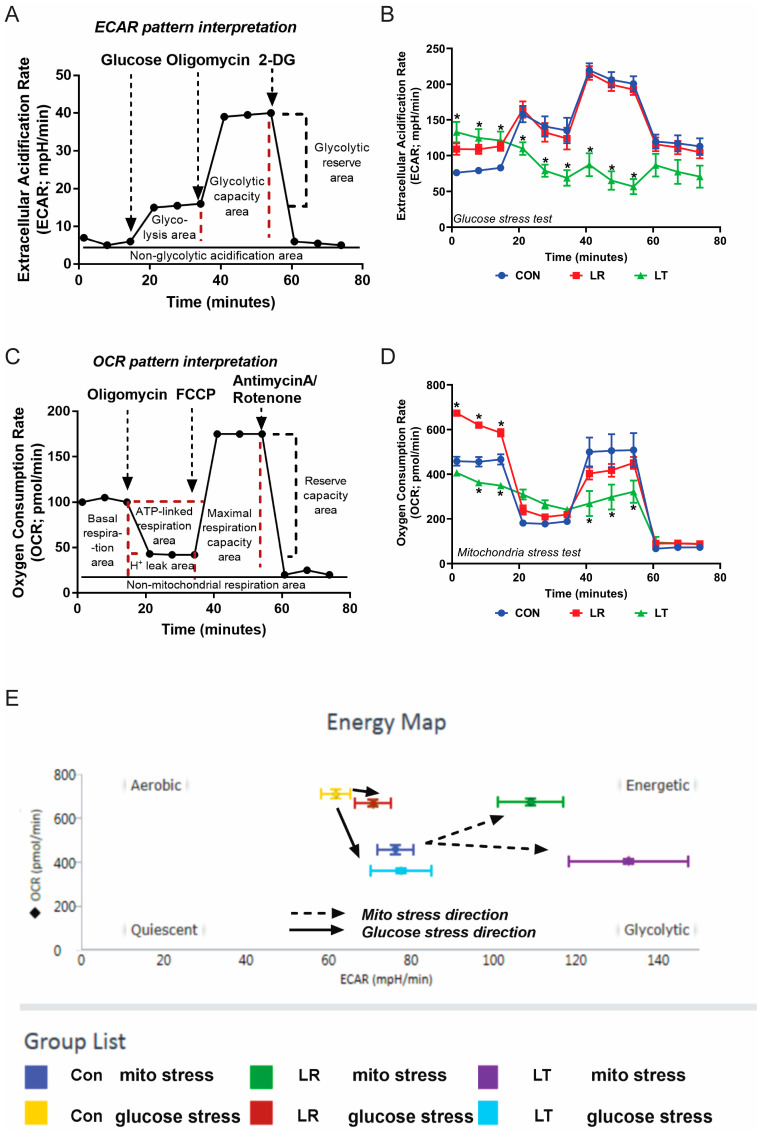
Figure 2.
LPS-tolerant RAW 264.7 cells have significantly decreased cellular metabolism compared to LPS-responding and unstimulated cells. The general pattern of the estimation of glycolysis and mitochondrial functions through extracellular acidification rate (ECAR) and oxygen consumption rate (OCR), respectively (A,C); the pattern of macrophages treated with LPS either once (LPS-Responding (LR, red)) or twice (LPS-Tolerant (LT, green)) and untreated control samples (Con, blue) (B,D) (combination from triplicate experiments for B,D), and the energy map calculated using the Seahorse XF Extracellular Flux Assay (E). * = p-value < 0.001.

