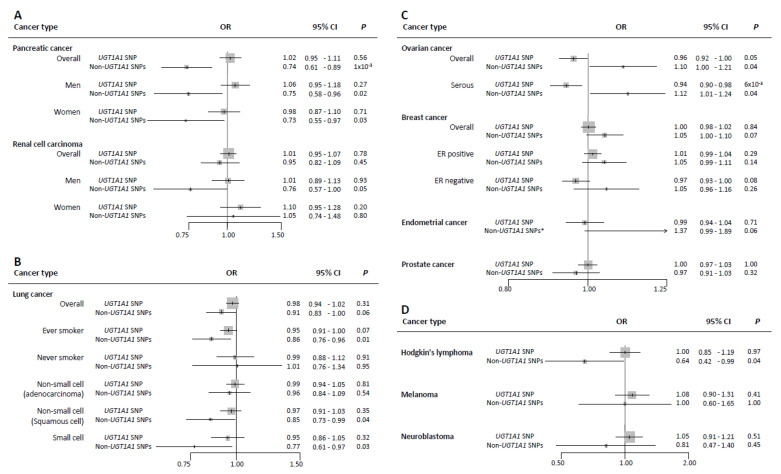
Figure 1.
Forest plot of associations between genetically-predicted bilirubin levels and risk of ten cancers (per one-standard deviation (1-SD) increment in circulating total bilirubin levels equivalent to ≈4.4 µmol/L). (A): The association between 1-SD increment in bilirubin levels predicted by UGT1A1 SNP and the non-UGT1A1 SNPs with risks of pancreatic cancer and renal cell carcinoma (overall, men, and women). (B): The association between 1-SD increment in bilirubin levels predicted by UGT1A1 SNP and the non-UGT1A1 SNPs with risk of lung cancer (overall, ever smoker, never smoker, adenocarcinoma, squamous cell, and small cell lung cancers. (C): The association between 1-SD increment in bilirubin levels predicted by UGT1A1 SNP and the non-UGT1A1 SNPs with risks of ovarian cancer (overall and serous), breast cancer (overall, ER positive, and ER negative), endometrial cancer, and prostate cancer. (D): The association between 1-SD increment in bilirubin levels predicted by UGT1A1 SNP and the non-UGT1A1 SNPs with risks of Hodgkin’s lymphoma, melanoma, and neuroblastoma. The results are provided by a likelihood-based MR test, * with the exception of endometrial cancer, which results are provided by the Egger-MR test. Abbreviations: OR odds ratio, CI confidence interval, p p-value, ER estrogen receptor.

