Figure 5.
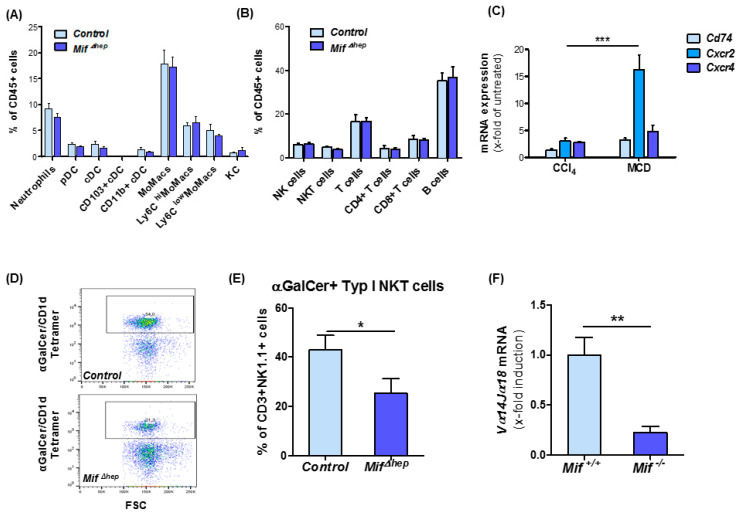
MifΔhep mice show reduced type I natural killer T (NKT) cell infiltration. (A) Analysis of myeloid cells in the liver and (B) lymphoid populations in the liver after 8 weeks of MCD diet-induced NASH in MifΔhep mice compared to control littermates in flow cytometry analysis. (C) MIF receptors analysis was performed by qRT-PCR after 8 weeks of MCD feeding compared to 6 weeks of CCl4 treatment from snap-frozen whole liver tissue. (D) Representative multicolor flow cytometry blots of type I NKT cell population. (E) Analysis of type I NKT cells in liver after 8 weeks MCD treatment in MifΔhep mice compared to control littermates. Type I NKT cells were gated as viable cells, single cells, CD45+, CD3+, NK1.1+ and α-GalCer/CD1d Tetramer+ signals. (F) Expression pattern of type I NKT related gene Vα14Jα18 was measured by qRT-PCR between MifΔhep mice and control littermates. All analyses were performed with n = 6 mice per group. Asterisks indicate statistical significance: * p < 0.05; ** p < 0.01; *** p < 0.001.

