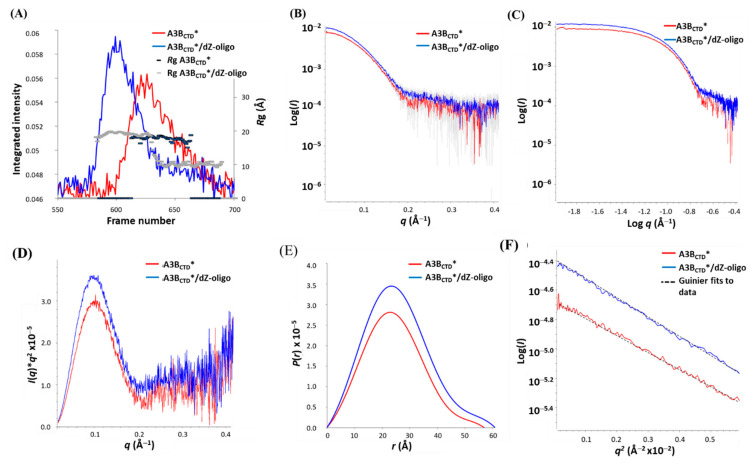
Figure 3.
SEC-SAXS analysis of A3BCTD* (red) and A3BCTD*/dZ-oligo complex (blue). (A) SAXS profile plots. (B) Scattering curves log I(q) versus q. (C) Double log plot of scattering. (D) Kratky plot. (E) P(r) distribution plot. (F) Guinier plots. Experiments conducted injecting into SEC-FPLC 5 mg/mL A3BCTD* and A3BCTD*/dZ-oligo at a 1 to 2 molar ratio in pH 5.5 buffer (see caption to Figure 2).

