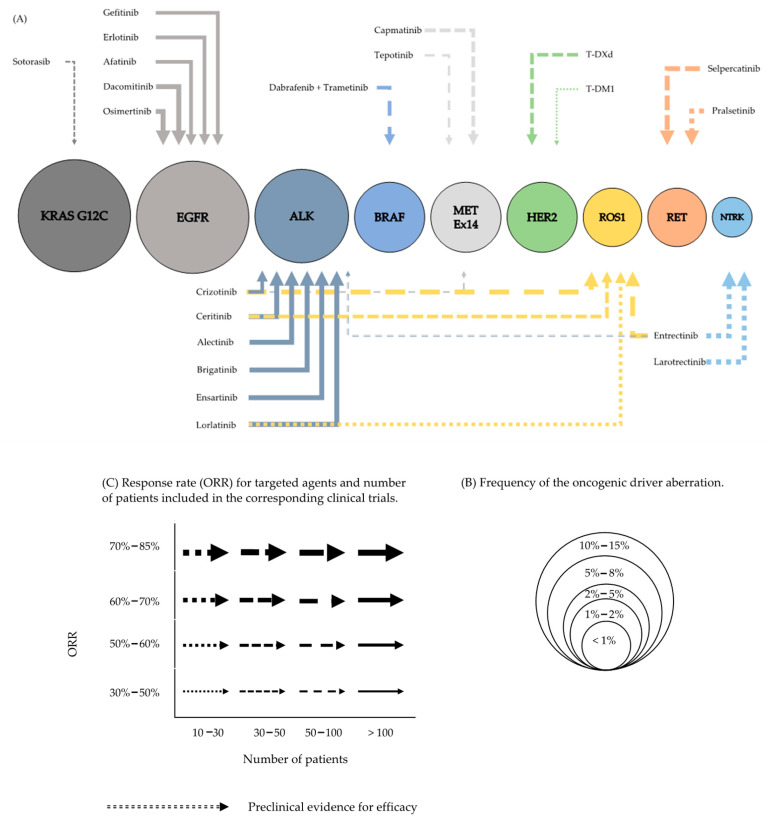
Figure 1.
Molecular oncogenic driver aberrations and targeted therapies. Graphic overview (A). The size of the circles indicates the frequencies of the oncogenic driver aberration (B). The arrow thickness reflects the magnitude of response (ORR) for every targeted agent and the style of the line (continuous, dashed, dotted) the number of patients included in the corresponding clinical trials (C).

