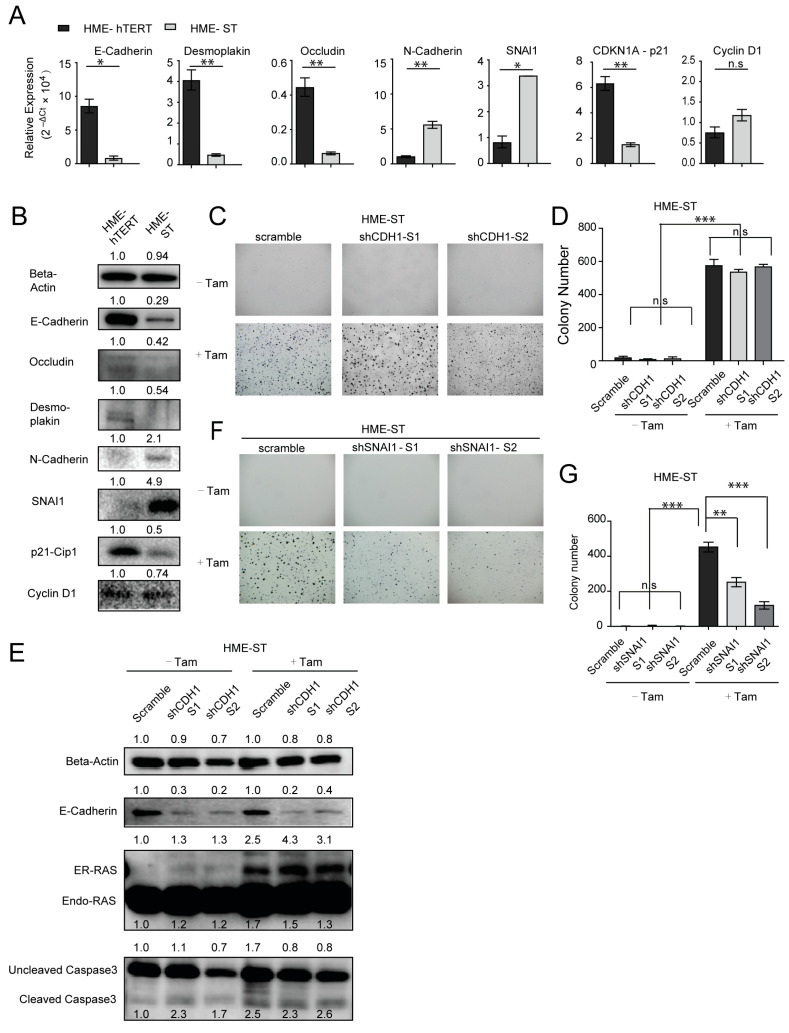
Figure 5.
SV40 small T antigen functions to induce EMT in HME-hTERT cells and enables the cells to survive and grow in soft agar independent of CDH1. (A) RT-PCR analysis of the indicated genes was performed on RNA samples extracted from HME-hTERT and HME-ST cells grown in anchorage-independent soft-agar colony formation assays (CFAs). Statistical significance is reported as p values computed using mean −ΔCt values and normalized SD; ** p ≤ 0.01; * p ≤ 0.05, n.s: Not Significant. Data shown are the relative expressions ((2−ΔCt × 104) ± normalized SD) from duplicate determinations of a single experiment that is representative of three such experiments. (B) Corresponding immunoblot analysis on samples similarly prepared as in panel A to evaluate the levels of the indicated proteins; samples were extracted from cells grown in soft agar. (C) Representative microscopic images of soft-agar CFAs of HME-ST cells expressing either a control shRNA (scramble) or two different shRNAs targeting CDH1, with or without tamoxifen-induced expression of CA-NRAS. (D) Quantitation of the data from the experiment shown in panels C; data are presented as mean ± SD numbers of colonies counted in three separate fields. (E) Immunoblot analysis of protein samples extracted from cells in soft agar corresponding to the conditions of panels C and D. (F) Representative microscopic images of soft agar colonies of HME-ST cells with or without expressing CA-NRAS and with the expression of either a control shRNA or two different shRNAs targeting SNAI1. (G) Quantitation of the data presented in panel F; data are presented as mean ± SD. ** p ≤ 0.01, *** p ≤ 0.001 (Student’s t-test).

