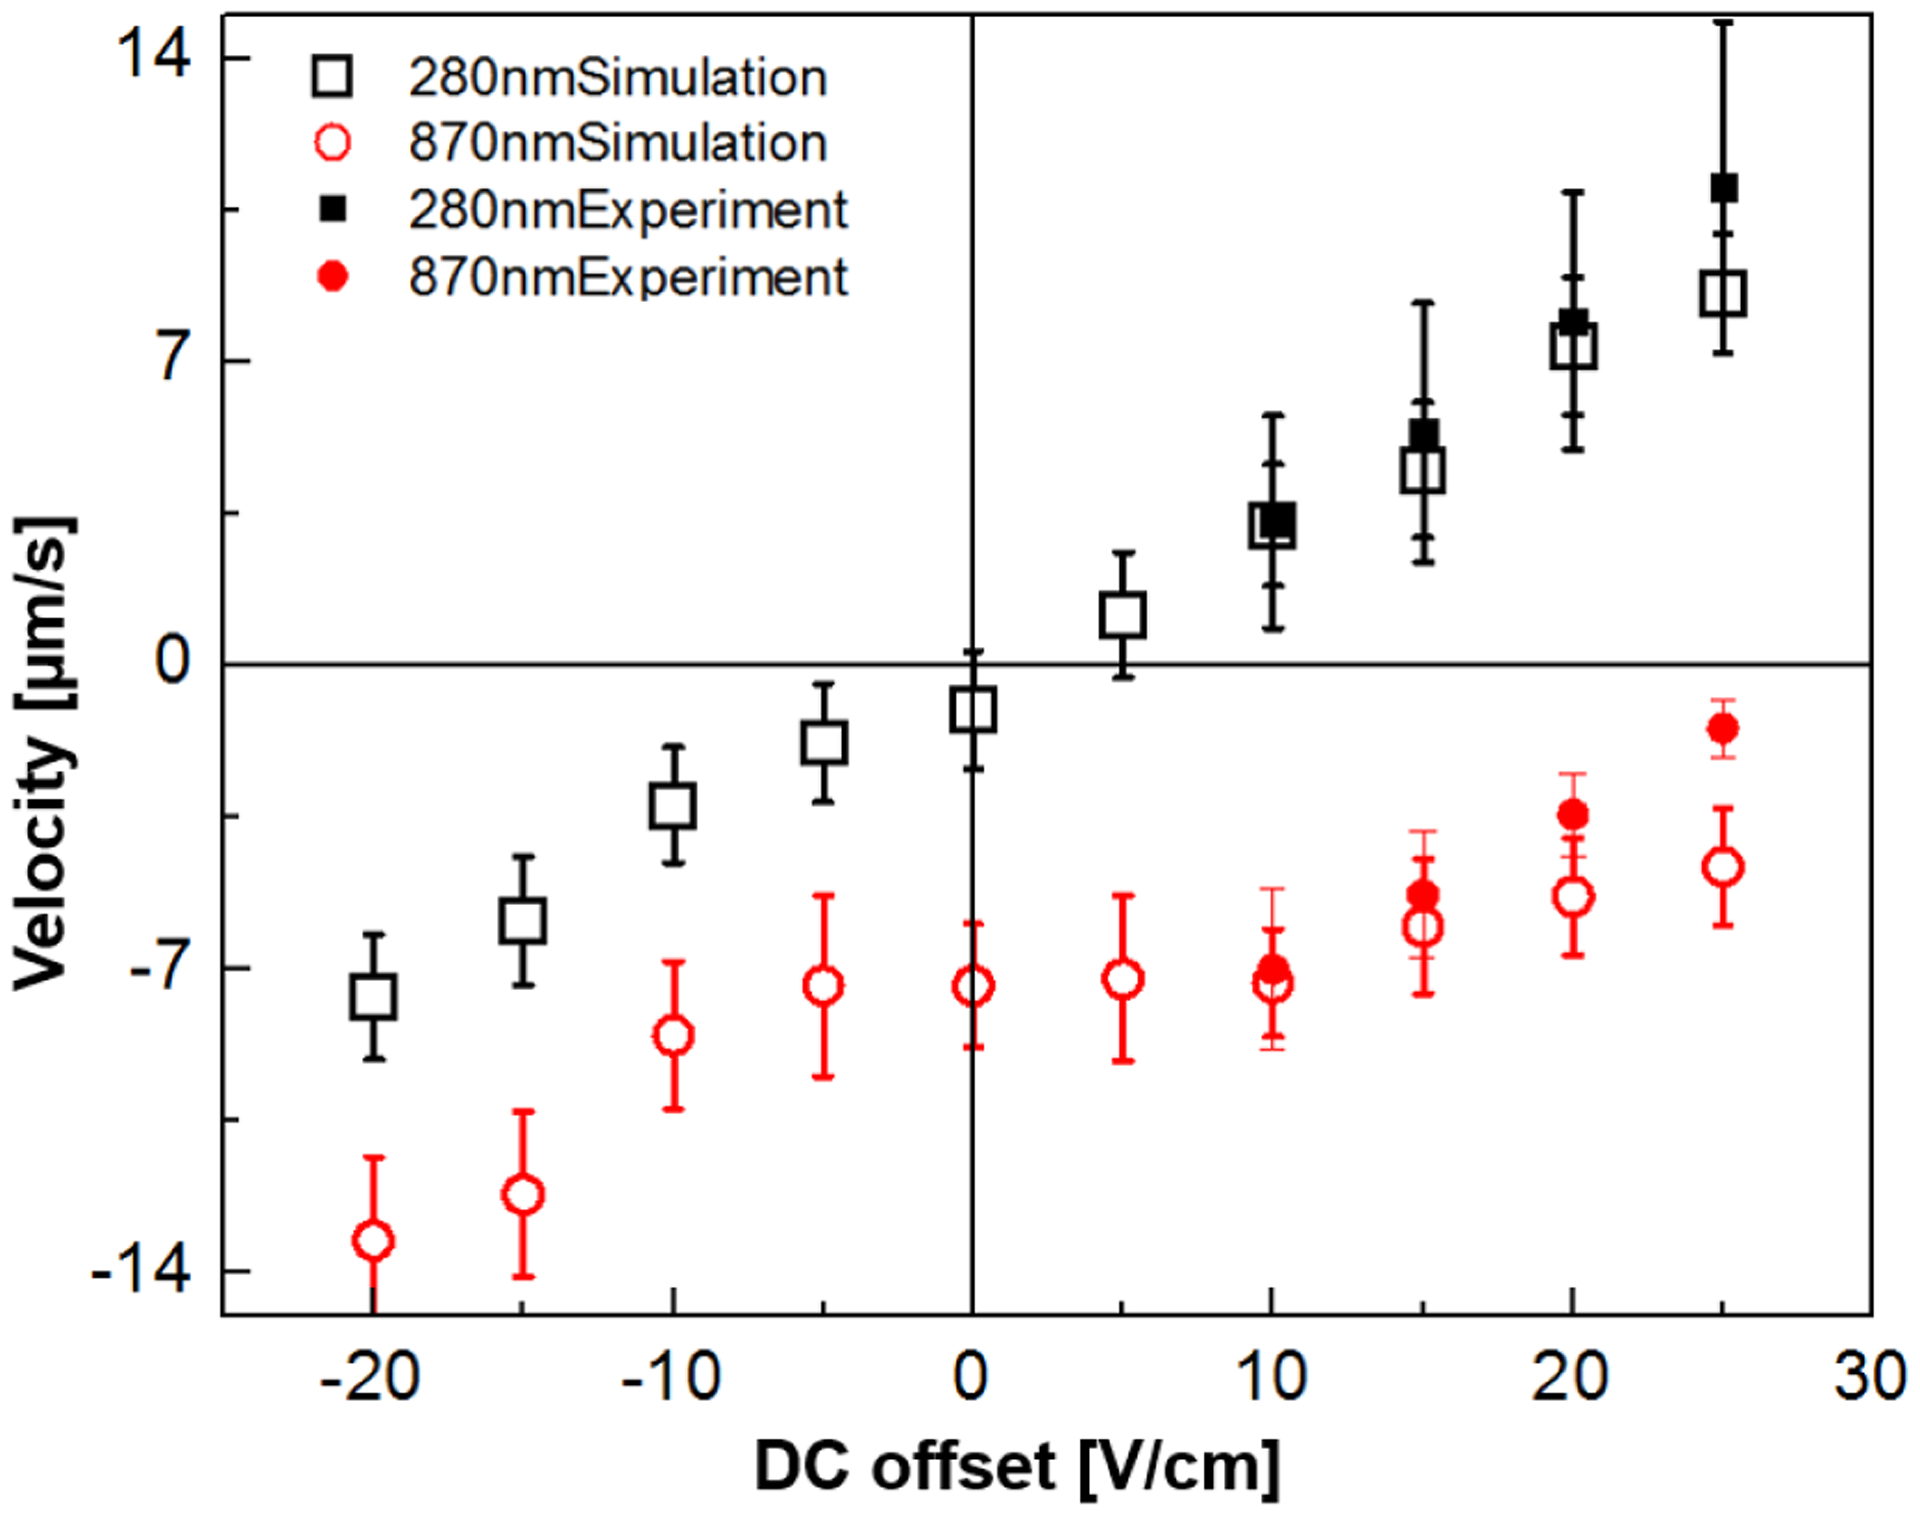
Figure 2.

Velocity variations of 0.28- and 0.87-μm-diameter polystyrene beads (empty symbols for numerical modeling results and solid symbols for experimental data) along the microchannel constriction at various Udc. The magnitude of the Uac_1 (τ=10s) and Uac_2 (f=30 kHz) were maintained at 50 V and 800 V, respectively. The error bars indicate the standard deviation of average velocity obtained at each Udc by tracking 60 or 300 individual trajectories from the experimental or the simulation results, respectively. At the applied Udc conditions from 0 to + 30 V in both the experiment and the numerical modeling, the average velocities of 0.87 μm particles were in the opposite direction to the applied Udc, showing apparent ratchet migration, whereas 0.28 μm particles showed the normal response with positive migration velocities according to the sign and magnitude of Udc.
