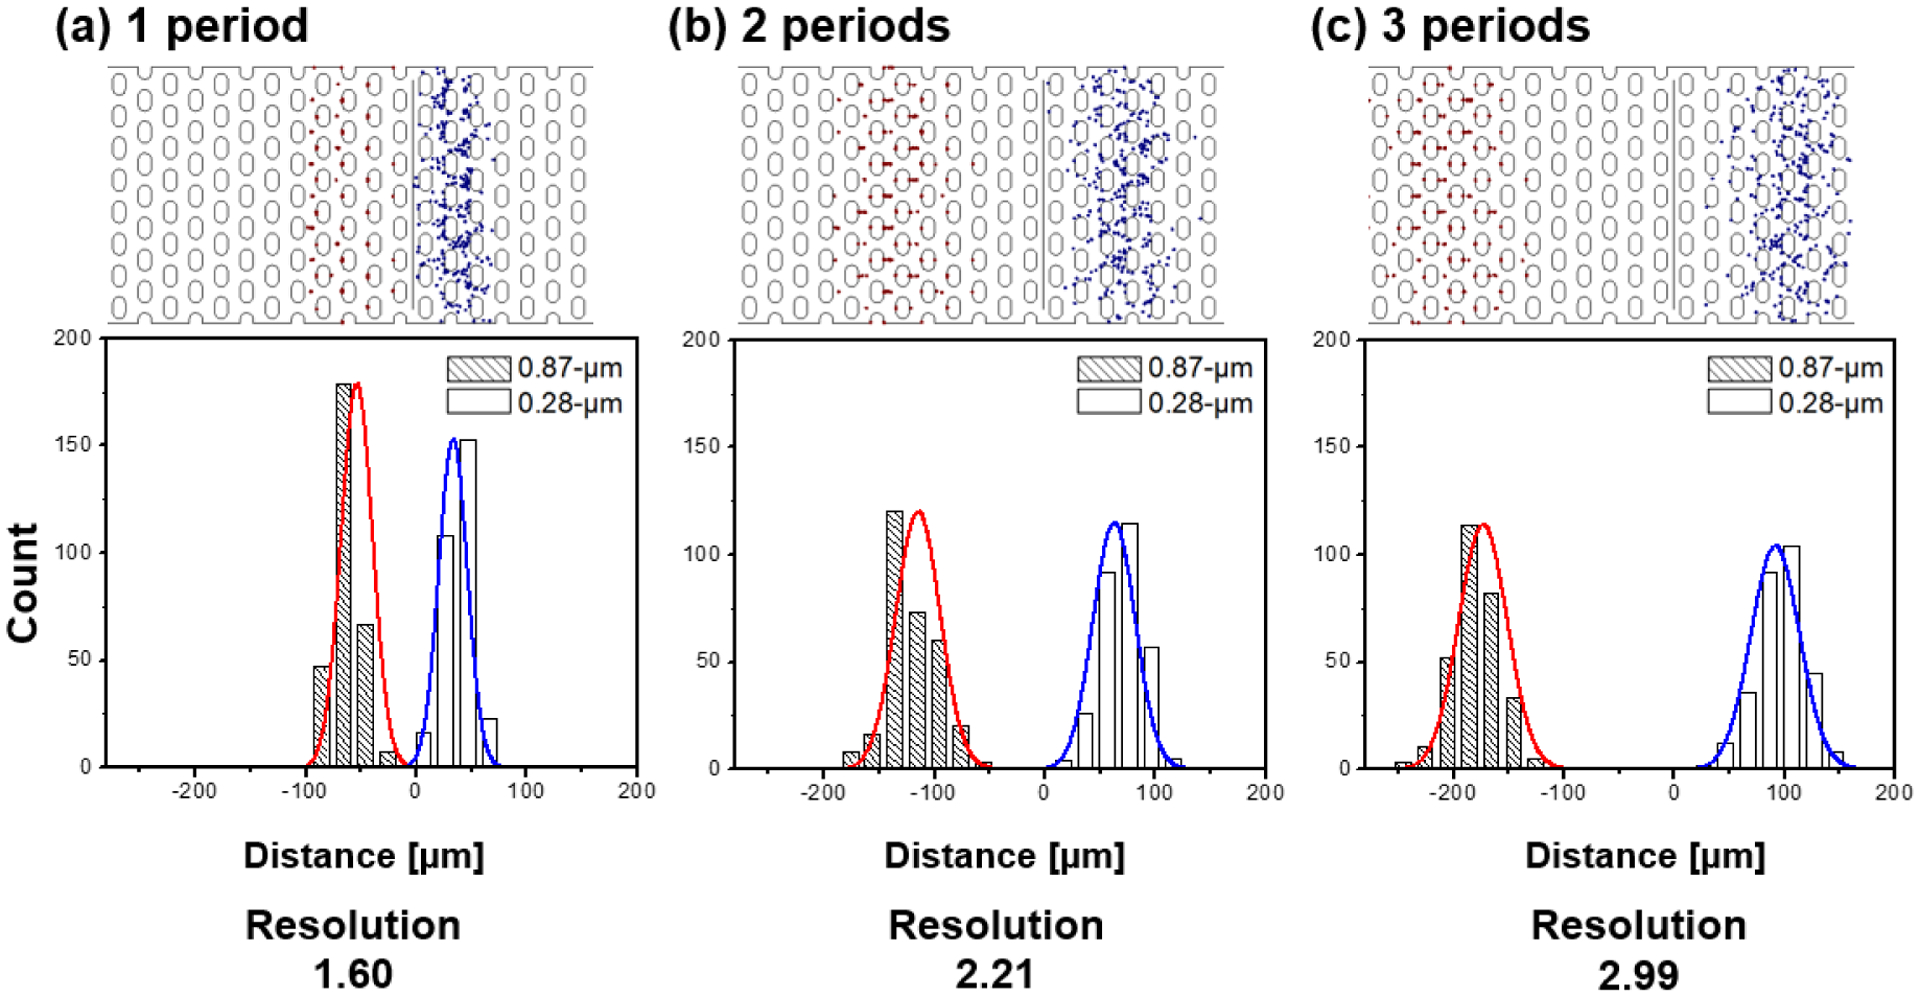
Figure 4.

Histogram and Gaussian fit are shown for the 0.87 μm(red) and 0.28 μm(blue) beads comparing the resolution at the end of multiple periods (n = 1,2,3). 300 particles are studied at Uac_1= 50 V, Udc = 10 V and Uac_2= 800 V at f = 30 kHz (τ = 10 s) in the numerical study. The resultant resolution values are (a) 1.60, (b) 2.21 and (c) 2.99, respectively. The distance in μm on the x-axis indicates the particle migration distance from the particle release line in the numerical model.
