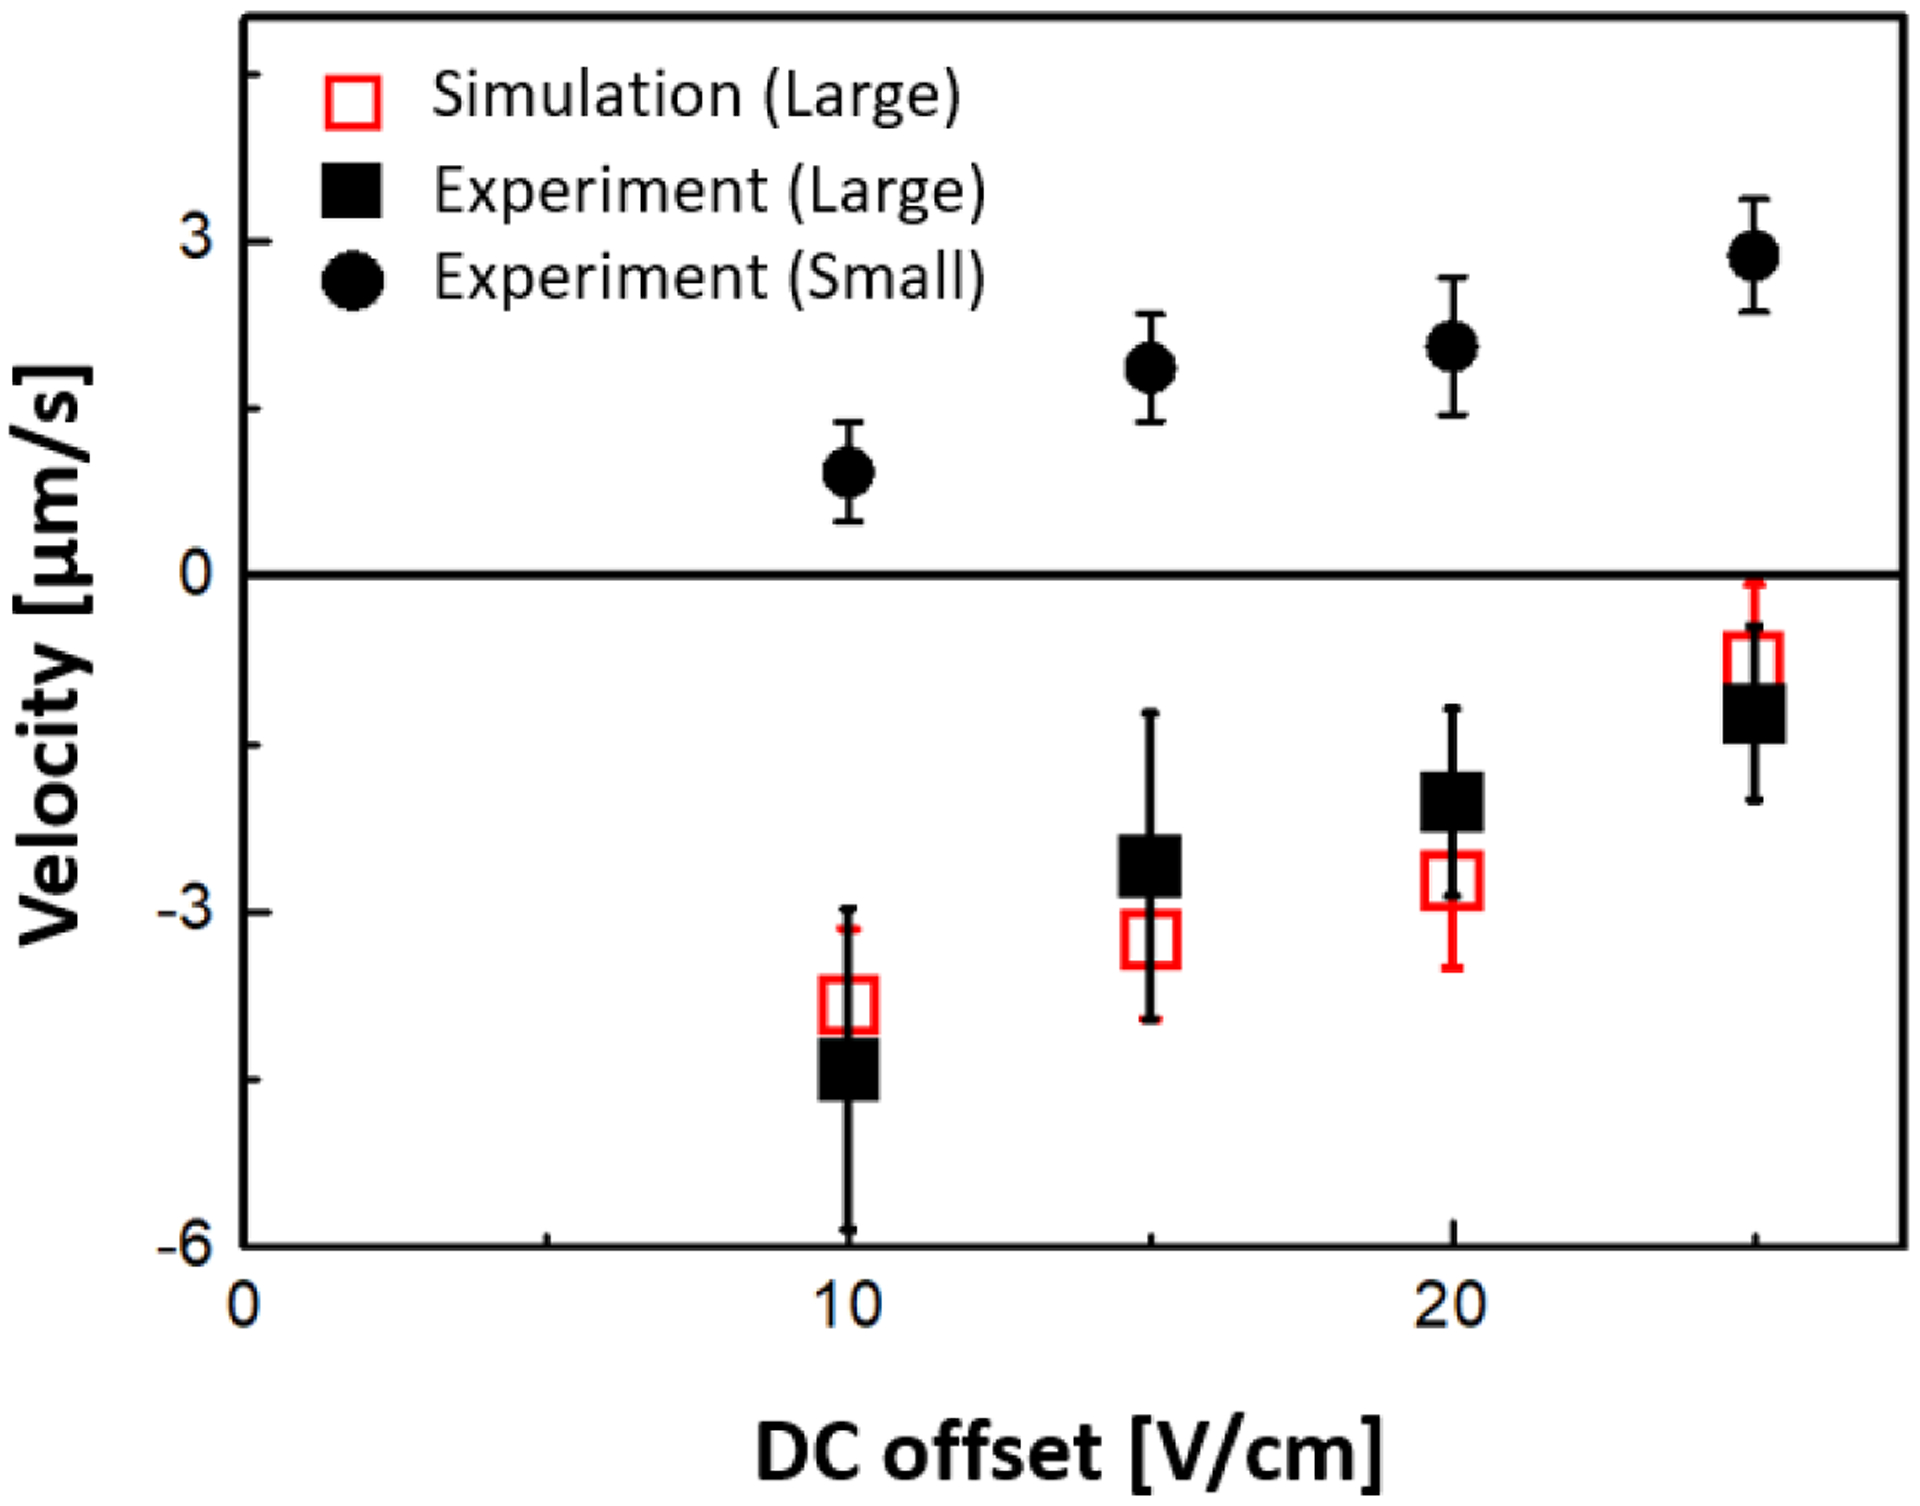
Figure 6.

Experimental and simulation results of velocity vs. Udc for the isolated mouse hepatic mitochondria. The error bars indicate the standard deviation of average velocity obtained at each Udc by tracking individual trajectories (10 particles for the small mitochondria and 60 particles for large mitochondria) from the experimental results, respectively. Here, Uac_1 = 35 V for Udc = 25 V, Uac_1 = 40 V for Udc = 20 V, Uac_1 = 45 V for Udc = 15 V, and Uac_1 = 50 V for Udc = 10 V were applied for one complete period with Uac_2 of 800 V and f = 30 kHz to induce DEP-based ratchet migration. At these experimental conditions, the average migration velocities of large mitochondria (black square) were negative demonstrating the ratchet mechanism and the average migration velocities of small mitochondria (black circles) were positive showing the normal migration. Red open squares indicate simulation results for 650 nm sized organelles (300 particles for large mitochondria were simulated).
