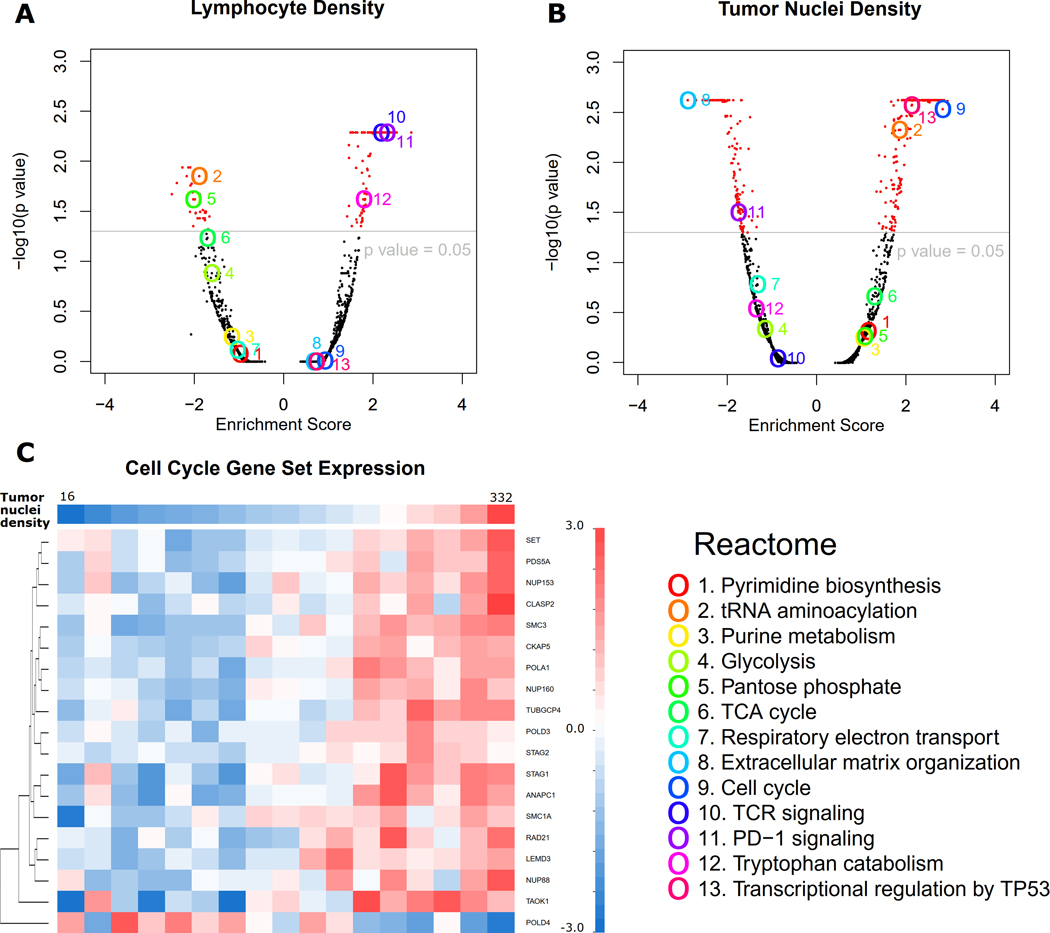
Figure 5. Correlation between image features and mRNA expression in tumor samples from the TCGA dataset.
(A-B) Volcano plots of gene set enrichment analysis results correlating mRNA expression level with lymphocyte density (A) and tumor nuclei density (B), respectively. Thirteen interesting gene sets (Reactome) are highlighted. (C) To look into the significantly correlated gene sets, an example of a heatmap shows that most mRNA expression levels in the cell cycle gene set positively correlate with tumor nuclei density in tumor issue. Only genes with p value < 0.001 in Spearman rank correlation with tumor cell number are shown. Patients are grouped according to tumor cell density showing on the top row.

