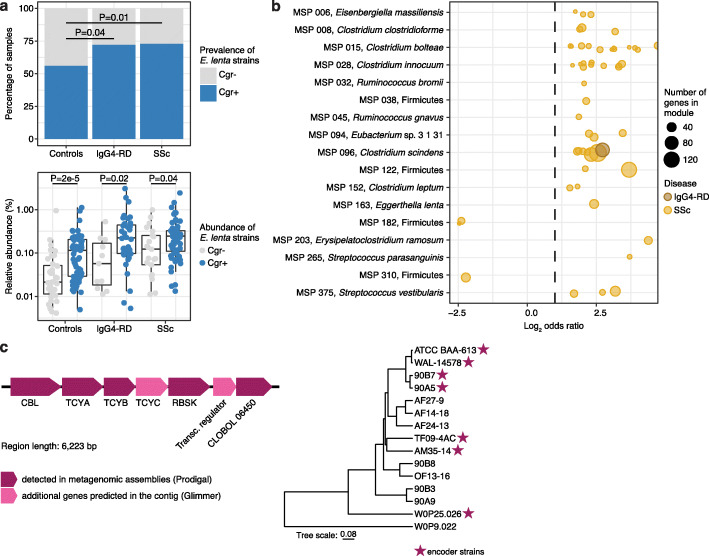
Fig. 3.
Strain-level signals in IgG4-RD and SSc. a Top, Strains of E. lenta are more likely to harbor a cgr operon (cgr+) in disease samples than healthy control samples (Fisher’s test, comparison with controls: IgG4-RD P = 0.04; SSc P = 0.01; N controls = 107, N IgG4-RD = 51, N SSc = 81). Bottom, Cgr+ E. lenta achieve a higher relative abundance than cgr− E. lenta in control, IgG4-RD, and SSc samples. Boxplots show median and lower/upper quartiles; whiskers show inner fences. b Species-specific accessory modules (acc) that are enriched or depleted in SSc or IgG4-RD compared to healthy controls (FDR < 0.05). Effect size is shown as log2 odds ratio. The number of genes contained in each accessory module is indicated by the size of a dot. c Accessory module acc 058 in C. bolteae. Left, Gene composition of the locus encoding cystine uptake and homocysteine metabolism genes. Right, NCBI’s phylogenetic tree of 15 C. bolteae reference genomes. Stars indicate strains encoding the locus

