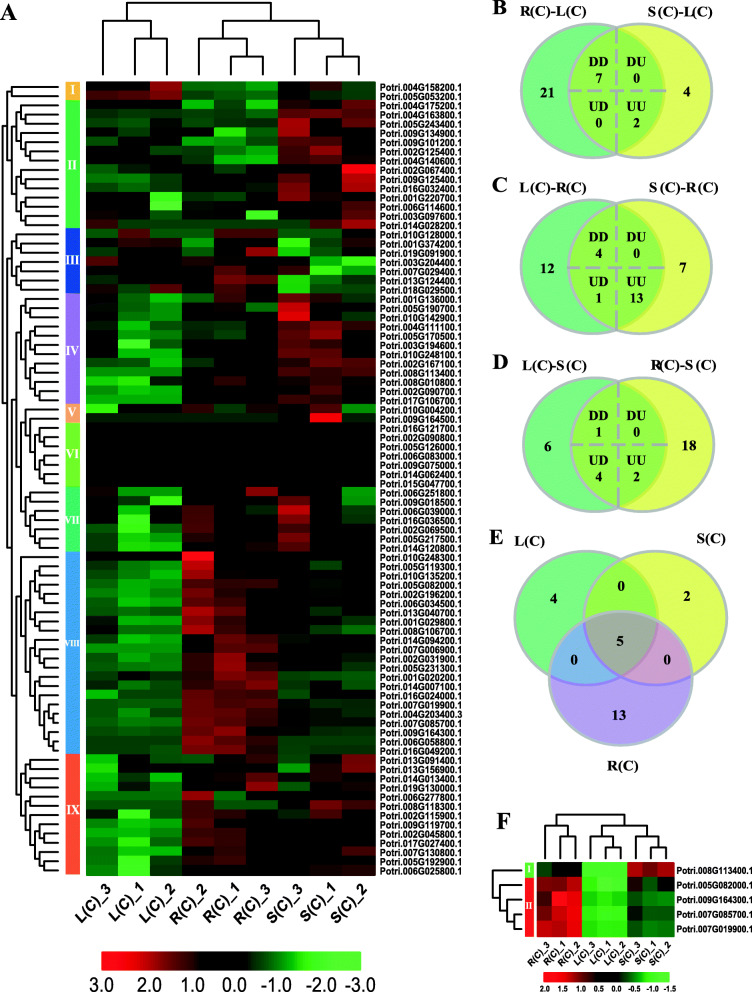
Fig. 7.
Differentially expressed bZIP genes over tissues in poplar. a Heatmap of poplar bZIP gene expression without treatment. b-d Number of tissue differentially expressed genes displaying distinct and shared expression between pairs of tissues without treatment. The numbers in the shared part of each figure are DEGs in one tissue relative to the other two tissues. DD and UU represent down- and up-regulated in the two comparisons. DU stands for down-regulation in the left comparison and up-regulation in the right comparison. UD is opposite to DU. e Comparisons of the shared genes from B to D. The shared five genes were differentially expressed in any tissue relative to the other two tissues. f Heatmap of five genes shared in panel E. L(C), S(C), and R(C) represent leaves, stems, and roots without treatment

