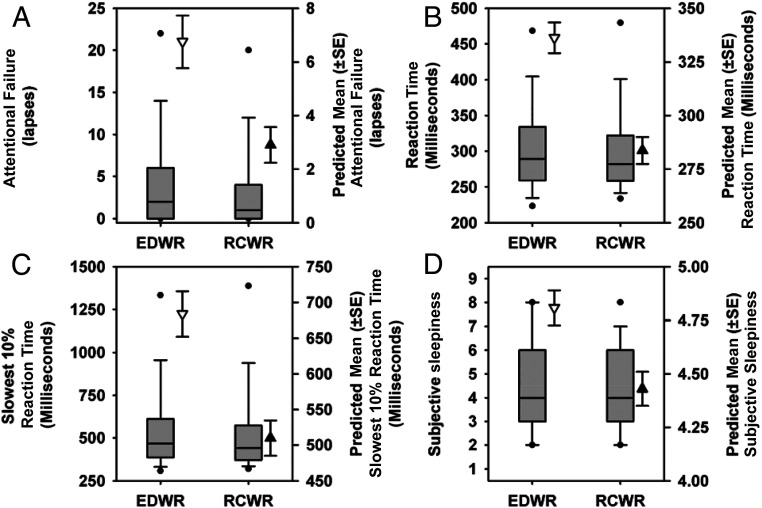
FIGURE 2.
Objective performance and subjective sleepiness ratings during the traditional EDWR and intervention RCWR schedules. The box and whisker plots depict the median (solid horizontal line), 25th and 75th percentiles (box limits), 10th and 90th percentiles (whiskers), and fifth and 95th percentiles (black circle) along with the predicted values (± SE) of each outcome estimated from the regression analyses shown next to each box and whisker plot under the EDWR (white triangles) and RCWR (black triangles) schedules for attentional failures (A) (lapses, reaction time >500 milliseconds), reaction time (B), slowest 10% reaction time (C), and subjective sleepiness ratings (D).

