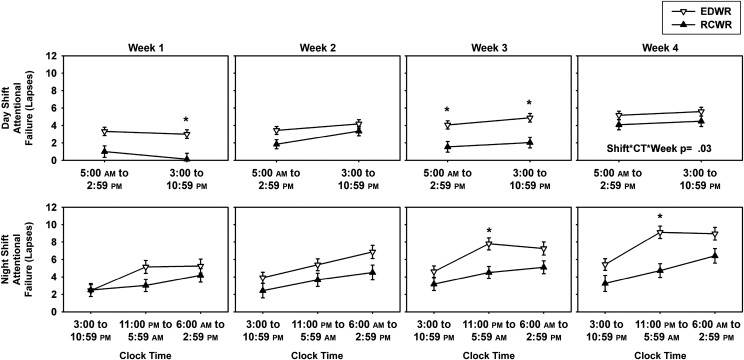
FIGURE 5.
Objective performance during the traditional EDWR and intervention RCWR schedules during the day and night across the 4-week study. Least-square means (± SE) are estimated from the mixed-effects model under the EDWR (white triangles) and RCWR (black triangles) schedules during the day (top row) and night (bottom row) for attentional failures (lapses, reaction time >500 milliseconds) plotted across the 4 weeks. Note that under the day shift interval of 5:00 am to 2:59 pm, Cincinnati started at ∼5:00 am, and all others started at ∼6:00 am. *P < .05, significant differences between conditions at each time point with Tukey-Kramer adjusted post hoc analysis. Shift*CT*Week, interaction between the fixed effects shift, clock time, and week.

