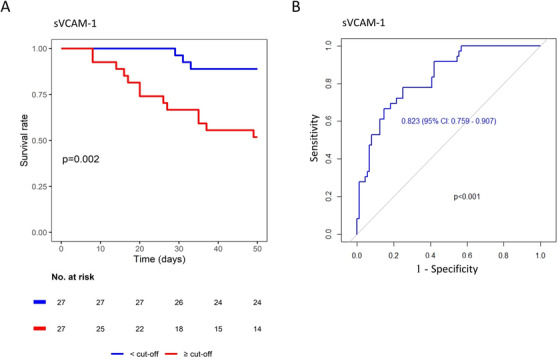
FIGURE 2.

A, Kaplan‐Meier analysis. Patients were stratified by soluble vascular cell adhesion molecule 1 (sVCAM‐1) median concentration in blood at hospital admission. Plot shows P‐value of the log‐rank test between groups. B, Time‐dependent ROC analysis of sVCAM‐1 blood concentration toward patients outcomes, showing area under the curve (AUC) with 95% confidence interval and its associated P‐value
