
Figure 3.
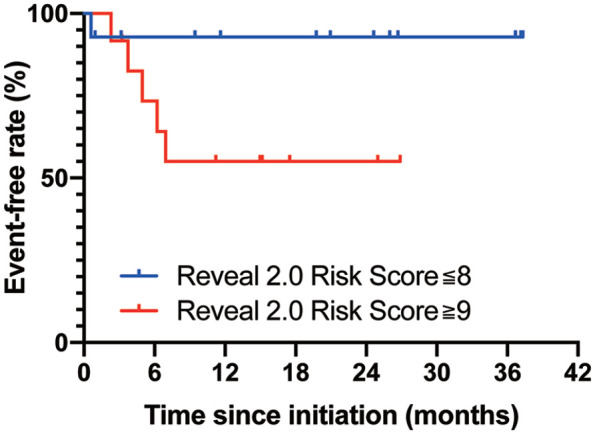
Kaplan–Meier curve for prostacyclin-free rate in each risk category.
The prostacyclin infusion-free rates in each risk category are shown. The patients were divided into two risk categories by the REVEAL 2.0 risk score.16 The p-values were calculated by the log-rank test.