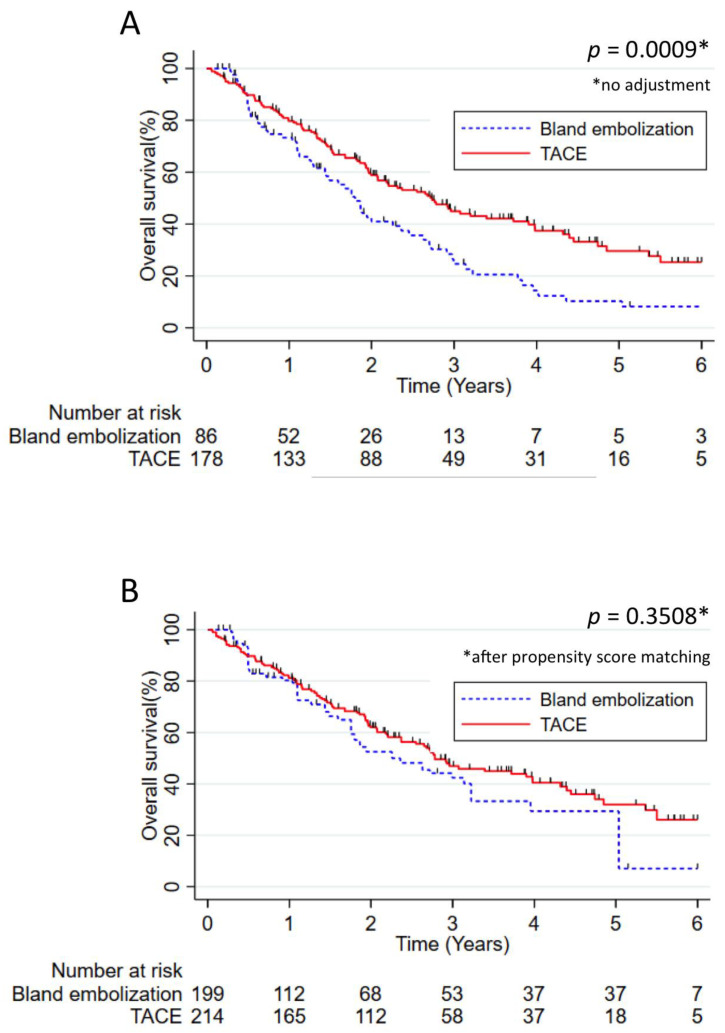
Figure 3.
Overall survival in patients treated by TACE versus patients treated by TAE. (A) Overall survival without adjustment and (B) overall survival adjusted using the propensity score. The results were analyzed using the Kaplan–Meier method and compared using the log rank test. Numbers at risk were reported under the x-axis.

