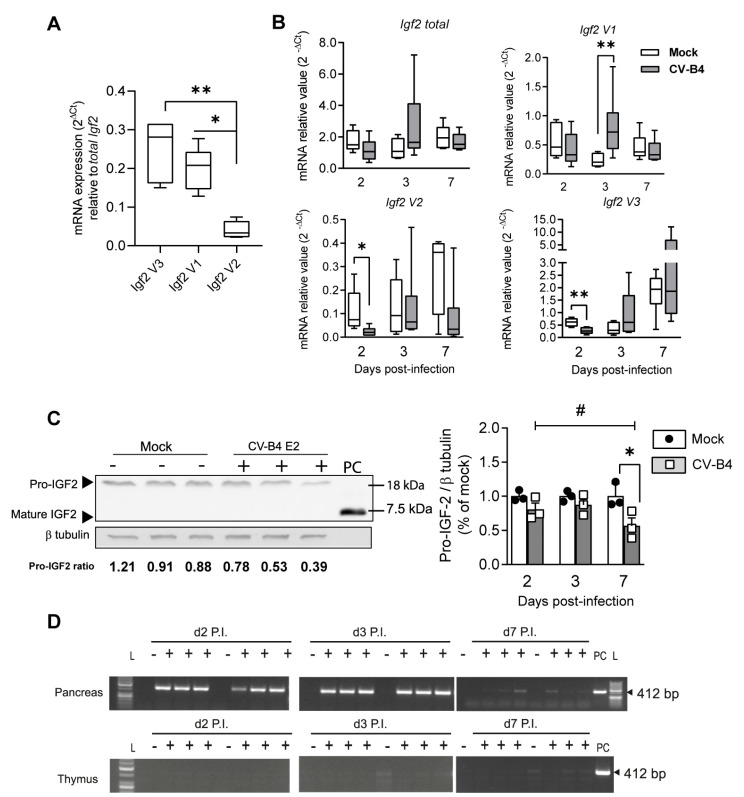
Figure 6.
Thymic Igf2 expression following CV-B4 inoculation in vivo. (A) Relative mRNA expression of Igf2 V3, V1, and V2 mRNA transcript isoforms in Cluster Differentiation 45 (CD45)-negative enriched thymic epithelial cells (TECs) in mock-inoculated mice on day 3 P.I.; n = 6. (B) Relative mRNA expression of the Igf2 mRNA transcript isoform in mock- and CV-B4-inoculated mice; box-and-whisker plots extend from minimum to maximum values with lines indicating medians; n = 5–6. Raw Ct values are indicated in Supplementary Table S1. (C) Left panel, representative Western blot of IGF2 and its precursors on day 7 P.I. in mock- (−) and CV-B4-inoculated mice (+). Independent biological samples are represented. PC, purified mature IGF2. Representative full-length Western blots of IGF2 and β-tubulin are presented in Supplementary Figure S9E. Right panel, relative quantification of pro-IGF2 in mock- and CV-B4-inoculated mice; the histogram represents the mean of relative value ± SD; n = 3. For relative quantification of pro-IGF2 expression, the ratios on days 2, 3, or 7 are normalized to the mean ratio of pro-IGF2 of mock samples on days 2, 3, or 7, respectively. (D) Agarose gel electrophoresis of one-step RT-PCR products of the CV-B4 genome in the digested thymus (total thymic cells) and matched pancreas in CV-B4- (+) and mock-inoculated mice (−). Independent biological samples are shown. L, ladder; PC, MTE4-14. Uncropped gels are presented in Supplementary Figure S9F. (A) One-way ANOVA, * p < 0.05, and ** p < 0.01. (B,C) Student’s t-test, * p < 0.05, and ** p < 0.01. (C) One-way ANOVA, # p < 0.05.

